How to Identify a Bubble in the Secondary Housing Market — Shanghai 2026

How to Identify a Bubble in the Secondary Housing Market — Shanghai 2026
If you own a Shanghai apartment or plan to shop for one, the question is no longer whether prices will rebound to their 2021 peak. The question is whether the market you are buying into is priced for fundamentals or for a narrative. In 2026, Shanghai's price-to-income ratio sits at 29.6 years — nearly six times the 5.0 threshold that Demographia classifies as "severely unaffordable" (Numbeo, 2026). That single number does not prove a bubble, but it is the kind of signal that precedes every major housing correction on record.
Housing bubbles are easy to spot in hindsight and nearly impossible to confirm in real time — until you measure the right indicators. This article walks through six classic bubble signals drawn from decades of cross-country evidence, then applies each one to Shanghai's secondary market as it stands in 2026. The goal is a framework you can use yourself, not a forecast — because nobody can tell you exactly when a bubble pops.
Key Takeaways
- Shanghai's price-to-income ratio of 29.6x is roughly six times the historical norm of 3-5x, a level consistent with past bubbles (Numbeo, 2026).
- Six indicators — price-to-income, price-to-rent, rental yield, inventory, transaction-volume divergence, and mortgage stress — together signal bubble risk more reliably than any single metric.
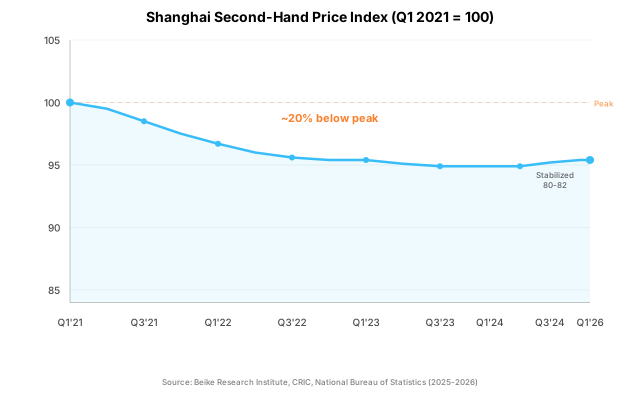
- Shanghai's secondary price index sits about 20% below its 2021 peak, but affordability metrics remain stretched far beyond warning thresholds.
- History shows housing busts last nearly twice as long as equity busts and produce output losses twice as large (IMF, 2003).
- The framework here applies to any market: compare local indicators against long-run thresholds, not against recent peaks.
What Exactly Is a Housing Bubble — And Why Can't Most People See One Coming?
A housing bubble is a sustained deviation of prices from fundamental values — income, rents, construction costs — that participants rationalize through a narrative of permanent scarcity or inevitable appreciation. In 2003, the IMF found that housing price busts last nearly twice as long as equity busts and lead to output losses twice as large (IMF World Economic Outlook, 2003). The reason they do so much damage is that real estate is illiquid, leveraged, and tied to household balance sheets in ways that stocks are not.
The hardest part of identifying a bubble is not the math. It is the story. Every bubble generates a convincing explanation for why "this time is different" — but does scarcity really explain a price-to-income ratio six times the historical norm? Shanghai's version of this narrative rests on land scarcity, hukou-linked benefits, and the belief that tier-1 Chinese cities are immune to the forces that hit smaller markets. Each argument contains a kernel of truth. None of them override the arithmetic of affordability.
According to research by Shiller (2005), home prices in the United States rose roughly 6% per year during the 1997–2002 boom while rents grew only about 3% annually — a divergence that signaled buyers were paying for appreciation expectations rather than housing services. When the gap between price growth and rent growth widens, it is one of the earliest and most reliable bubble signals.
What Are the Six Classic Indicators of a Housing Bubble?
Decades of cross-country research point to a consistent set of indicators that distinguish a bubble from a healthy price increase. But which indicators actually predict trouble — and which are just noise? The IMF, BIS, and Demographia have each published thresholds, and they converge on similar warning levels.
The first indicator is the price-to-income ratio — the number of years of median household income required to buy a median home. Historically, this ratio hovers around 3.0 or less in stable markets (Demographia). When it exceeds 5.0, Demographia classifies the market as "severely unaffordable." Goldman Sachs estimated in 2005 that US housing was overvalued by roughly 10% based on median price-to-income divergence from its long-run trend.
The second is the price-to-rent ratio, which compares the cost of owning to the cost of renting. In October 2004, the US price-rent ratio sat 18% above its long-run average — a level that preceded the 2006 crash. A high price-to-rent ratio means buyers are paying a premium that rental income cannot justify.
The third is gross rental yield — annual rent as a percentage of property value. A yield below 3% implies buyers are acquiring property for capital appreciation alone, not for the income it produces. That is a speculative posture.
The fourth is inventory months — the number of months required to sell all listed properties at the current sales rate. Rising inventory alongside flat or rising prices signals that supply is outstripping genuine demand.
The fifth is transaction-volume divergence — when prices hold steady or rise while the number of transactions falls, it indicates a thinning market held up by a shrinking pool of buyers.
The sixth is mortgage stress — measured by household debt-to-income ratios, mortgage delinquency rates, or the share of income consumed by mortgage payments. When debt grows faster than income for a sustained period, the system becomes fragile.
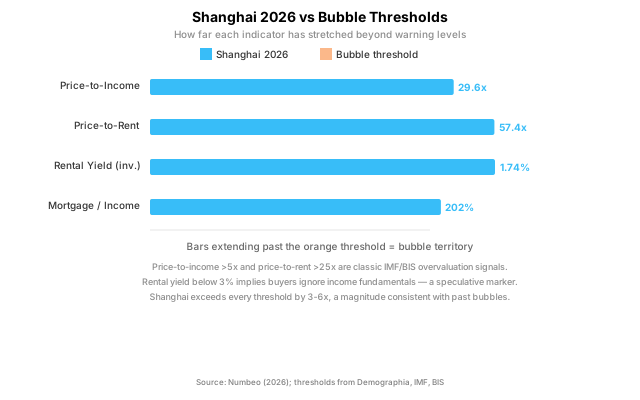
No single indicator confirms a bubble. But when four or more indicators flash warning levels simultaneously — as they do in Shanghai in 2026 — the pattern is hard to dismiss as noise.
What Does Shanghai's Secondary Market Look Like in 2026?
In 2026, Shanghai's secondary housing market presents a paradox that should trouble any buyer: prices have fallen roughly 20% from their 2021 peak, yet affordability remains stretched far beyond historical norms. Is a 20% correction enough? The second-hand price index sits at approximately 82 (Q1 2021 = 100), down from 100 and stabilizing in the 80–82 range since late 2024 (Beike Research Institute, CRIC, National Bureau of Statistics, 2025–2026). A 20% correction sounds painful. Whether it is enough depends entirely on where prices stand relative to fundamentals.
Start with the price-to-income ratio. In 2026, Shanghai's ratio stands at 29.55 years — meaning a median household would need nearly three decades of income, saving every yuan, to buy a median apartment (Numbeo, 2026). The historical norm is 3-5 years. Even after the 20% price correction, the ratio has barely budged because incomes have not risen fast enough to close the gap.
The price-to-rent ratio tells the same story from the other side. Shanghai's city-centre price-to-rent ratio sits at 57.37, and outside the centre at 48.20 (Numbeo, 2026). A ratio above 25 is generally considered overvalued. At 57, it would take nearly five decades of rental income to recoup the purchase price — an implicit bet that prices will keep rising.
Gross rental yield confirms the picture. Shanghai's city-centre yield is 1.74%, and outside the centre 2.07% (Numbeo, 2026). A yield below 3% means the property does not pay for itself as an investment. Buyers at these levels are purchasing for appreciation, not income.
Inventory and transaction data add context. Shanghai's second-hand inventory stands above 180,000 active listings in 2026, with an absorption cycle of roughly 9–11 months at current sales velocity (CRIC, 2025 Q4). Transaction volume recovered to roughly 220,000–240,000 units in 2025, up 8–10% year-on-year, but volume without price recovery is the signature of a transitional buyer's market (CRIC, 2025). The marginal buyer who would bid above asking is absent.
Mortgage stress completes the picture. Shanghai's mortgage payments consume roughly 202% of household income on the standard measure — more than double the threshold that signals affordability strain (Numbeo, 2026). China's broader household debt-to-GDP ratio reached 63.67% in 2023, up from 27.56% in 2010 (IMF, 2023). Debt grew faster than income for a decade.
How Does Shanghai Compare to Other Tier-1 Cities — and to Past Bubbles?
Shanghai does not exist in isolation. But how does its valuation stack up against peer cities and the bubbles of the past? Comparing its indicators against both shows whether today's pricing is an outlier or part of a broader pattern.
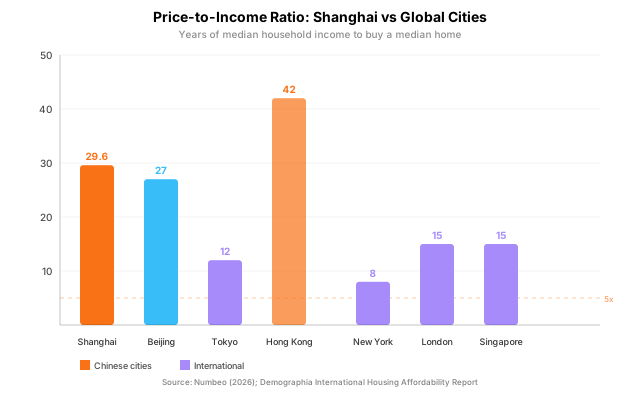
In 2026, Shanghai's price-to-income ratio of 29.6 years ranks among the highest in the world (Numbeo, 2026). Beijing sits at 27 years. Hong Kong, the global outlier, reaches 42 years. By contrast, Tokyo stands at 12 years, New York at 8, and London and Singapore at 15 each. The gap between Chinese tier-1 cities and international peers is not a small premium — it is a different order of magnitude.
The historical comparisons are equally instructive. Japan's six-city residential land price index peaked in 1991. By 2004, prime Tokyo residential land traded at less than a tenth of its bubble value (Japan Real Estate Institute, 2024). It took until 2018 — 27 years — for nationwide Japanese land prices to post a single year of nominal growth. The S&P CoreLogic Case-Shiller National Home Price Index fell 27.6% nationally from 2006 to 2012, and the 10/20-City composites fell roughly 33–35% (S&P Global, 2024). In both cases, affordability ratios at the peak looked similar to Shanghai's today.
According to a 2012 laboratory study cited in the real estate bubble literature, housing markets experience more drawn-out boom-bust periods than financial markets because real estate is less liquid — prices decline more slowly, but the correction lasts longer. That asymmetry matters for Shanghai: a slow grind is more likely than a sudden crash, but the total duration of pain can be greater.
Shanghai differs from Tokyo 1990 and the US 2006 in one important respect: policy control. Chinese authorities can restrict supply, ease purchase rules, and direct credit in ways that Tokyo's and Washington's governments could not. That does not eliminate the bubble. It shapes how the correction unfolds.
What Policy and Macro Factors Could Delay or Deflate the Bubble?
In 2026, Shanghai's policy environment is actively working against a disorderly correction — which is exactly what makes timing a bubble's peak so difficult. First-home mortgage rates sit around 3.50–3.60% (5Y LPR minus basis points), down from well over 5% — historically low by Chinese standards (People's Bank of China, 2026). Down-payment ratios have been cut and purchase restrictions eased.
The property tax question looms larger. Shanghai has levied a property tax pilot since 2011, but coverage is narrow and rates are low. A broad rollout at meaningful rates would raise holding costs and could trigger a wave of selling from multi-property owners. The absence of that rollout so far has removed one of the most powerful deflationary forces.
Demographics work in the opposite direction. China's total population has been declining since 2022 — the first drop since 1961 — and its working-age population has been shrinking since 2012 (National Bureau of Statistics, 2024). Fewer households forming means fewer buyers a decade from now. Real estate's share of GDP has already fallen from 14.45% in 2021 to 12.94% in 2024 (National Bureau of Statistics, 2024), a structural contraction that policy can slow but not reverse.
The honest caveat is that bubble timing is unreliable. Markets can remain overvalued for years — sometimes a decade — before correcting. It's the one thing even seasoned analysts get wrong. The indicators tell you the risk level, not the calendar date.
How Can Buyers and Sellers Use These Signals in 2026?
The framework above is not an abstract exercise. But how do you translate indicators into actual decisions? It produces concrete decision rules for anyone active in Shanghai's secondary market.
For buyers, start with the rent-versus-buy math. At a 1.74% gross rental yield and a 3.32% mortgage rate, renting is cheaper than buying on a cash-flow basis in most Shanghai districts (Numbeo, 2026). The only case for buying is if you expect prices to appreciate enough to close that gap — which is a speculative bet, not a household decision. Stress-test any purchase against a further 10–15% price decline. If the monthly payment is unaffordable at that level, you are buying on the assumption that prices only rise.
For sellers, inventory above 180,000 units and an absorption cycle of 9–11 months mean the market is structurally oversupplied (CRIC, 2025 Q4). The average listing spends 90–120 days on market before closing (Beike Research Institute, 2025). If you are selling a non-prime unit in an outer-ring district, the leverage sits with the buyer. Price 3–5% below the most recent comparable transaction rather than hoping to match peak-era comps.
For both sides, track four numbers monthly: the price-to-income ratio, rental yield, inventory months, and transaction volume. When three or more move in the seller's favor, the window is open. When three or more move against you, patience is the better trade.
Frequently Asked Questions
Is Shanghai's secondary market a bubble, or just supply-constrained?
Shanghai's land scarcity is real, but scarcity only drives prices up when demand is growing. In 2026, the city's price-to-income ratio of 29.6x is six times the historical norm of 3-5x (Numbeo, 2026). Scarcity explains a premium; it does not explain a ratio that high. At some point, scarcity pricing becomes speculative pricing — buyers paying not for the apartment but for the bet that someone else will pay more.
How does the current situation compare to Shanghai's 2015-2016 boom?
The 2015-2016 rally was a policy-driven stimulus cycle: mortgage rates fell, purchase restrictions eased, and prices rose roughly 30-40% in 18 months. The difference in 2026 is that prices are already 20% below peak and affordability has barely improved (Beike Research Institute, 2025-2026). The 2015 boom started from a sustainable base. The current market is correcting from an unsustainable one.
What policy change would most likely deflate Shanghai's valuations?
A meaningful property tax rollout. Shanghai's pilot since 2011 covers only a narrow slice of holdings at low rates. A broad tax of 0.5-1.5% on assessed value for second and subsequent properties would raise holding costs, unlock speculative inventory, and reset buyer expectations. Markets that rely on zero holding cost for investment properties are markets waiting for a trigger.
Should I buy or rent in Shanghai right now?
At a 1.74% gross rental yield versus a 3.32% mortgage rate, renting wins on cash flow in most districts (Numbeo, 2026). Buying makes sense only if you plan to hold for 10+ years, can absorb a further 15% price decline, and value the non-financial benefits of ownership. If your reason for buying is "prices always go up in tier-1 cities," that is a speculation, not a strategy.
How do Shanghai's bubble indicators compare to Tokyo in 1990?
Tokyo's price-to-income ratio peaked at roughly 18-20x in 1990 before its three-decade decline (Japan Real Estate Institute, 2024). Shanghai's ratio of 29.6x in 2026 is 50-60% higher than Tokyo's bubble peak (Numbeo, 2026). The comparison does not guarantee the same outcome, but it shows that Shanghai's starting valuation leaves less room for soft-landing scenarios.
Conclusion
Shanghai's secondary housing market in 2026 is not crashing — it is repricing slowly against a backdrop of stretched affordability. The six-indicator framework shows a market where price-to-income, price-to-rent, rental yield, inventory, transaction divergence, and mortgage stress all flash warning levels simultaneously. A 20% correction from peak has not been enough to restore affordability because the starting valuation was so far above historical norms.
The lesson from Tokyo, the US, and the UK is not that Shanghai will follow the same path. It is that housing markets correct more slowly and more painfully than participants expect, and that the correction lasts longest in the cities that entered it with the highest valuations. For buyers and sellers in Shanghai, the practical move is to measure indicators against thresholds — not against the memory of the peak.
Sources
- Numbeo, Shanghai Property Investment data, August 2026, https://www.numbeo.com/property-investment/in/Shanghai
- Beike Research Institute (贝壳研究院), Shanghai second-hand price index, 2025-2026, https://www.ke.com
- CRIC (克而瑞), Shanghai housing inventory and transaction data, 2025, https://www.cric.com
- National Bureau of Statistics (国家统计局), 2024-2026, https://www.stats.gov.cn
- People's Bank of China (中国人民银行), mortgage rate data, 2026, https://www.pbc.gov.cn
- IMF, World Economic Outlook, 2003, https://www.imf.org
- IMF, household debt-to-GDP data, 2023, https://www.imf.org
- Japan Real Estate Institute, residential land price index, 2024, https://www.reinet.or.jp
- S&P Global, CoreLogic Case-Shiller Home Price Index, 2024, https://www.spglobal.com
- Demographia International Housing Affordability Report, https://demographia.com