How to Make the Right Investment Decisions If Macroeconomic Statistics Are Inaccurate

Introduction
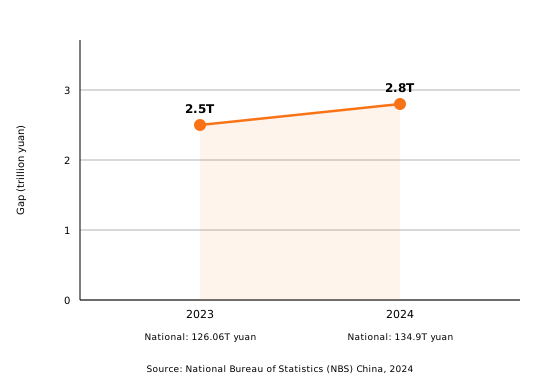
In 2024, the Bureau of Labor Statistics dropped a bombshell: the US economy had created 306,000 fewer jobs than originally reported for the year through March (BLS, 2024). That wasn't a rounding error. It was a 0.2% downward revision that rewrote the labor market story investors had traded on for months. Meanwhile, across the Pacific, China's 31 provinces reported a combined GDP of 137.7 trillion yuan — yet the national bureau reported only 134.9 trillion. The gap was 2.8 trillion yuan (NBS China, 2024).
These aren't isolated incidents. They're symptoms of a structural problem: the macroeconomic statistics investors rely on are often unreliable, revised dramatically, or — in some cases — deliberately falsified. Building a portfolio on headline GDP, employment, or inflation data is like navigating with a compass that points five degrees off. You might still reach your destination, but the journey will cost you.
So how do you invest wisely when the numbers themselves can't be fully trusted? This article examines why macro data is so unreliable, compares the US and Chinese statistical systems, and gives you a practical framework for making better decisions despite the noise.
Key Takeaways
- In 2024, US payrolls were revised down by 306,000 jobs; China's provincial GDP exceeded the national total by 2.8 trillion yuan.
- NBER announces recession troughs up to 21 months after they occur — investors must identify turns independently.
- 67% of institutional investors now use alternative data; you should triangulate official stats with independent sources.
- Focus on direction, not precision: build a margin of safety and track revisions as a signal.
Why Do Macroeconomic Statistics Get Revised So Often?
In 2024, the Bureau of Economic Analysis reported that the historical average revision between the advance and third GDP estimates is 0.6 percentage points (BEA, 2024). That means the "final" growth number you trade on in January can shift meaningfully by the time the third estimate arrives. The advance-to-second gap averages 0.5 pp; second-to-third averages 0.3 pp.
Why such large revisions? Initial GDP estimates are built from incomplete data. The advance estimate relies on surveys that cover only 40-60% of the actual economic activity. As tax records, census data, and corporate filings trickle in over months, the picture changes. It's not incompetence — it's the inherent challenge of measuring a $28 trillion economy in real time.
I learned this the hard way during the 2022 rate-hike cycle. Every quarter, markets would lurch on the advance GDP print, only to reverse when the second and third estimates arrived. The "strong consumer" narrative in Q2 2022 evaporated when revised data showed far weaker spending. Investors who traded the headline were whipsawed. Those who waited for the third estimate — or simply ignored the noise — kept their capital intact.
China's revision problem is different and arguably worse. The issue isn't incomplete data collection; it's systematic over-reporting by local officials whose careers depend on hitting GDP targets. In 2024, the sum of provincial GDP figures exceeded the national total by approximately 2.8 trillion yuan (NBS China, 2024). That gap has persisted for decades, narrowing only slightly after the 2019 "unified GDP calculation" reform gave the National Bureau of Statistics more direct control.
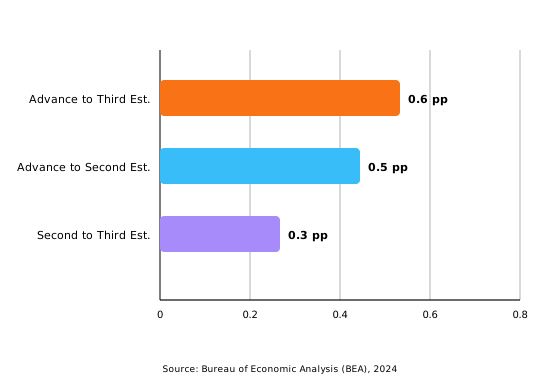
The takeaway for investors is clear: the first release of any major macro statistic is a rough draft, not a final answer. According to the BEA's own historical analysis, the advance-to-third revision averages 0.6 percentage points — enough to turn a "strong" quarter into a mediocre one (BEA, 2024). Professional investors treat initial prints as directional signals and wait for revised data before making major allocation changes.
How Reliable Are US Economic Indicators in 2026?
The US has the world's most transparent statistical system, but "transparent" doesn't mean "instantly accurate." The NBER Business Cycle Dating Committee — the official arbiter of recessions — announces turning points with staggering delays. The March 1991 trough wasn't declared until December 1992, a lag of approximately 21 months (NBER, 2020). The November 2001 trough took 20 months to confirm. Even the 2020 COVID trough required 15 months.
What does this mean in practice? By the time NBER says a recession ended, the market has typically already rallied 20-30%. Waiting for official confirmation means missing the recovery. Investors who relied on NBER dates to time their entries would have bought in 15-21 months too late, repeatedly, across decades.

The employment data has its own credibility gap. The BLS birth-death model — which estimates jobs created by new businesses not yet in the survey — contributed to an overestimate of approximately 818,000 payroll jobs for the year ending March 2024 (Wolf Street, 2024). The model had been assuming 100,000-150,000 net new jobs per month from business formation, an assumption that proved wildly optimistic as startup activity slowed and closures accelerated.
CPI shelter data presents yet another timing problem. The Zillow Observed Rent Index leads CPI shelter inflation by approximately 6 months (Zillow Research, 2024). Because BLS captures lease renewals over time rather than new-market rents, the official shelter component lags reality by half a year or more. In 2023-2024, anyone reading CPI shelter as "still elevated" was actually looking at rents that had already fallen in real time.
Here's the uncomfortable truth: the most-cited US economic indicators are systematically backward-looking by the time they're published. According to the NBER's own announcement history, recession troughs are declared an average of 12-15 months after they occur (NBER, 2020). For investors, this means real-time decision-making requires supplementing official data with higher-frequency alternatives.
What Makes Chinese Economic Data Harder to Trust?
If US data is a delayed photograph, Chinese data is a painting — sometimes more art than science. The most dramatic evidence came in waves of admissions: Liaoning province in January 2017, Inner Mongolia and Tianjin in January 2018. These weren't statistical errors. They were confessions of deliberate, systematic falsification.
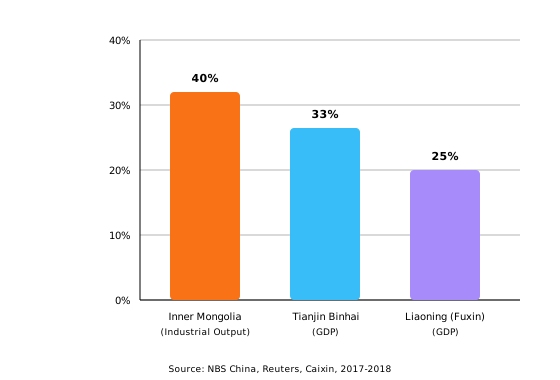
In Liaoning, officials admitted to fabricating GDP and fiscal revenue data over multiple years, particularly during 2010-2014. Fuxin City alone inflated its GDP by 20-30% in some years (Reuters, 2017). Former provincial party chief Wang Min was sentenced to life in prison, and the scandal exposed a system where local officials had every incentive to over-report and no incentive to tell the truth.
Inner Mongolia's admission was even more striking. In January 2018, the region revealed that its 2016 industrial output data had been inflated by approximately 40%, while fiscal revenue was revised down by roughly 17.6% (Reuters, 2018). Tianjin Binhai New Area admitted to inflating its GDP by about one-third — reporting roughly 1 trillion yuan when the true figure was closer to 665 billion.
Here's what most analysts miss: the falsification wasn't random. It correlated with political cycles. The worst over-reporting occurred in the years around provincial party congresses, when officials were up for promotion. This means the data distortion has a predictable pattern — it's worst precisely when you'd most want accurate numbers, during leadership transitions. Investors who understand this cycle can anticipate when Chinese data is least reliable.
The provincial-national GDP gap persists as a real-time reliability gauge. In 2024, the gap was approximately 2.8 trillion yuan (NBS China, 2024). A widening gap suggests more local over-reporting; a narrowing gap suggests either better central oversight or — more troublingly — that the national figure is being adjusted to meet targets. Either way, the gap itself becomes a data point worth tracking.
According to Reuters' coverage of the 2017-2018 admissions, at least three Chinese provinces confessed to systematic GDP falsification within a 12-month period (Reuters, 2018). The scale — 20-40% inflation of key metrics — means that any investment thesis built solely on Chinese official macro data carries an unquantifiable layer of risk.
Which Alternative Data Sources Can Replace Official Statistics?
If official data is unreliable, what should investors use instead? In 2024, 67% of institutional investors reported using alternative data sources for investment decisions, up from 58% in 2023 (Greenwich Associates, 2024). Even more telling, 89% of those users plan to increase spending in 2025. The smart money has already moved on.
In the US, several alternatives offer real-time or near-real-time reads. The ADP National Employment Report, released one day before the BLS nonfarm payrolls, provides a private-sector payroll count based on actual payroll data from 25 million workers. The ISM Purchasing Managers' Indexes — both manufacturing and services — offer monthly sentiment reads that often diverge from hard data, providing an early signal of turning points.
For inflation tracking, the Zillow Observed Rent Index (ZORI) leads CPI shelter by approximately 6 months (Zillow Research, 2024). During the 2022-2023 inflation surge, ZORI peaked and began declining a full half-year before CPI shelter caught up. Investors who tracked Zillow data understood the true rent trajectory long before the official numbers confirmed it.

For China, the alternatives are different but equally valuable. The Caixin Manufacturing PMI, compiled by IHS Markit from a survey of smaller private firms, frequently diverges from the official NBS PMI (which skews toward large state-owned enterprises). When the two PMIs diverge by more than 2 points, it often signals that the official data is painting an overly optimistic picture.
Satellite imagery has become a powerful verification tool. Night-light intensity data from satellites correlates strongly with electricity consumption and industrial output. During the Liaoning falsification period, satellite night-light data showed far weaker economic activity than the official GDP figures claimed — a discrepancy that, had it been monitored in real time, would have raised red flags years before the admission.
Credit card transaction data, shipping container volumes, cement production, and electricity output all serve as "shadow" indicators for China. None is perfect on its own, but together they form a mosaic that's far harder to manipulate than a single GDP number. The key insight is this: no single alternative source replaces official data, but a composite of independent sources is nearly impossible to fake.
How Should Investors Adjust Their Framework When Data Is Uncertain?
Now for the practical question: how do you actually invest when you know the data is flawed? The answer isn't to ignore macro data entirely — it's to change how you use it. Here are four principles that work.
First, use multiple independent sources. Never rely on a single statistic. If GDP says the economy is strong but satellite data, PMI surveys, and credit card transactions all say it's slowing, trust the consensus of the alternatives. Triangulation beats precision.
Second, focus on direction, not precision. Does it matter whether GDP grew 2.4% or 2.8%? For most allocation decisions, what matters is whether growth is accelerating or decelerating. The BEA's own data shows the advance-to-third revision averages just 0.6 percentage points (BEA, 2024) — a range narrow enough that the directional signal usually survives the revision.
Third, build a margin of safety. If you know employment data can be revised by 300,000+ jobs and GDP by 0.6 percentage points, don't position for the exact number. Build portfolios that are robust across a range of outcomes. This is the same principle as buying stocks below intrinsic value — you're protecting against being wrong.
Fourth, track revisions as a signal. Revisions aren't random noise; they contain information. When preliminary data consistently overestimates (as the birth-death model did in 2023-2024), the bias itself becomes a tradable signal. Persistent downward revisions suggest the economy is weaker than the headline implies — a bearish signal for cyclical exposure.
Here's a contrarian thought: data uncertainty is itself an alpha source. The wider the gap between official statistics and alternative indicators, the more mispricing you'll find. In 2024, investors who tracked the BLS birth-death model's overestimation could have positioned for a cooling labor market months before the August revision confirmed it. The uncertainty isn't a bug — it's a feature, if you know how to read it.
According to Greenwich Associates' 2024 survey, 67% of institutional investors now use alternative data, and 89% plan to increase spending next year (Greenwich Associates, 2024). The institutions that profit most from unreliable official data are those that invest in independent verification — not those that blindly trust the headline print.
What Are the Biggest Risks of Ignoring Data Reliability?
The cost of trusting flawed data isn't theoretical — it shows up in real portfolio losses. The 2013 "taper tantrum" is a textbook case. When Chairman Bernanke hinted at QE tapering on May 22, 2013, the 10-year Treasury yield spiked from 1.66% to 2.20% in roughly six weeks — a 54 basis point surge (FRED, 2013). Investors positioned for the "strong recovery" narrative embedded in real-time data got crushed.
China's equity markets offer an even starker warning. The Shanghai Composite lost roughly 40% of its value between June and August 2015. Weak PMI data and deteriorating macro indicators had been flashing warnings for months, but many investors trusted the official GDP growth target of "around 7%" and stayed long. Those who read the alternative data — electricity output, railway cargo, corporate earnings — exited months earlier.
The forward-looking risk is equally serious. As AI-powered data analysis becomes cheaper and more accessible, the gap between official statistics and real-time alternatives will widen further. Investors who still rely solely on government data will find themselves on the wrong side of an increasing number of trades. The tools to verify official data are now available to anyone — the question is whether you'll use them.
According to FRED data from the 2013 taper tantrum, the 10-year Treasury yield rose 54 basis points in six weeks following Bernanke's unexpected signal (FRED, 2013). That move wiped out billions in bond portfolio value — losses that investors who tracked real-time Fed communication rather than backward-looking data could have avoided.
Frequently Asked Questions
How often does the US revise its GDP figures?
The US releases three quarterly GDP estimates — advance, second, and third — each incorporating more complete data. The historical average revision from advance to third estimate is 0.6 percentage points (BEA, 2024). Annual benchmark revisions and comprehensive five-year revisions can shift numbers further. For investors, the practical implication is that any single GDP print is provisional.
Why does China's national GDP differ from the sum of provincial GDP?
China's provincial GDP figures consistently exceed the national total because local officials face strong incentives to over-report. The 2024 gap was approximately 2.8 trillion yuan (NBS China, 2024). The NBS applies adjustments for inter-provincial trade flows and eliminates double-counting, but the structural gap persists. At least three provinces have admitted to systematic falsification since 2017.
What is the Li Keqiang index?
The "Li Keqiang index" refers to three indicators — railway cargo volume, electricity consumption, and medium-to-long-term loan growth — that former Premier Li Keqiang reportedly used to gauge China's true economic health, considering them harder to manipulate than GDP. While the index isn't published officially, economists track these components as shadow indicators. When they diverge from official GDP, the alternative measures are usually more reliable.
Can alternative data really replace official statistics?
Not entirely — but it doesn't need to. In 2024, 67% of institutional investors used alternative data alongside official statistics, not instead of them (Greenwich Associates, 2024). The goal is triangulation: use satellite imagery, PMI surveys, and high-frequency transaction data to verify what official numbers claim. Where they agree, you have conviction. Where they diverge, you have caution.
How do professional investors handle unreliable macro data?
Professionals treat initial data releases as directional signals, not gospel. They wait for revised data before making major allocation changes, track alternative indicators in real time, and build portfolios with enough margin of safety to survive significant revisions. The key mindset shift: accept that macro data is always imperfect, and invest accordingly.
Conclusion
Macroeconomic statistics are indispensable — and inherently unreliable. The US revises its GDP by 0.6 percentage points on average, takes up to 21 months to confirm recession troughs, and overestimated payrolls by hundreds of thousands of jobs in 2024. China's provinces have admitted to inflating GDP by 20-40%, and the provincial-national gap persists at 2.8 trillion yuan. These aren't bugs in the system; they're features of any large-scale statistical apparatus.
The investors who thrive aren't those who find perfect data — they're the ones who build frameworks that work despite imperfect data. Triangulate official statistics with independent sources. Focus on direction rather than precision. Build a margin of safety. And treat revisions not as noise, but as a signal worth trading on.
The age of blind trust in government statistics is over. The age of data-literate investing has begun.
Sources
- Bureau of Economic Analysis, Gross Domestic Product Fourth Quarter and Year 2023 Advance Estimate, 2024, https://www.bea.gov/news/2024/gross-domestic-product-fourth-quarter-and-year-2023-advance-estimate
- Bureau of Labor Statistics, Preliminary 2024 Benchmark Revision, 2024, https://www.bls.gov/ces/notices/2024/preliminary-benchmark-revision.htm
- NBER Business Cycle Dating Committee Announcements, 2020, https://www.nber.org/research/business-cycle-dating/business-cycle-dating-committee-announcements
- National Bureau of Statistics (NBS) China, 2024, https://www.stats.gov.cn/
- Reuters, coverage of Liaoning GDP falsification, 2017, https://www.reuters.com/
- Reuters, coverage of Inner Mongolia data falsification, 2018, https://www.reuters.com/
- Zillow Research, ZORI Data, 2024, https://www.zillow.com
- Greenwich Associates, Institutional Investors Increase Alternative Data Adoption, 2024, https://www.greenwich.com/press-release/institutional-investors-significantly-increase-alternative-data-adoption
- Federal Reserve Economic Data (FRED), 10-Year Treasury Yield (DGS10), 2013, https://fred.stlouisfed.org/series/DGS10
- Wolf Street, BLS Birth-Death Model Analysis, 2024, https://wolfstreet.com/2024/
- Brookings Institution, What Explains the 2013 Taper Tantrum, https://www.brookings.edu/articles/what-explains-the-2013-taper-tantrum/