How Can Machine Learning Detect High-Risk P2P Lenders? A Retrospective Case Study
How Can Machine Learning Detect High-Risk P2P Lenders? A Retrospective Case Study
In 2019 we built an end-to-end platform that crawled public records and transaction data for more than 800 P2P Internet-finance platforms, trained four machine-learning models, and ranked each firm by composite risk. The best classifier, a support-vector machine, reached 94% test-set accuracy (AUC 0.9393) on 352 labeled platforms, flagging the high-risk ones weeks or months before they failed.
This post walks through how we collected the data, why we combined ML with a manual Analytic Hierarchy Process (AHP) model, and how we surfaced the results through a D3.js dashboard. It is a technical case study in feature engineering, class-imbalance handling, and risk visualization, skills that transfer to credit scoring, fraud detection, and any domain where you need to separate risky actors from healthy ones.
A note on context. China's P2P lending industry was effectively shut down by regulators between 2019 and 2021, with thousands of platforms closed or forced to exit the market (Reuters, 2020). This project, completed in early 2019, captures the final years of that industry. We publish it not as current market analysis, but as a reproducible case study in ML-based financial risk detection.
Key Takeaways
- An SVM classifier reached 94% accuracy (AUC 0.9393) on 352 P2P datasets, outperforming random forest (93%) and decision tree (85%) in flagging high-risk lenders.
- Seven risk dimensions were collected from 800+ platforms via Scrapy crawlers and the China Internet Finance Association (NIFA) disclosure platform.
- A hybrid approach cross-validated data-driven ML against an AHP expert model, trading raw accuracy for explainable risk scores.
- China's P2P lending industry was shut down by regulators in 2019-2021; this post is a retrospective ML case study, not current market guidance.
Technical Roadmap
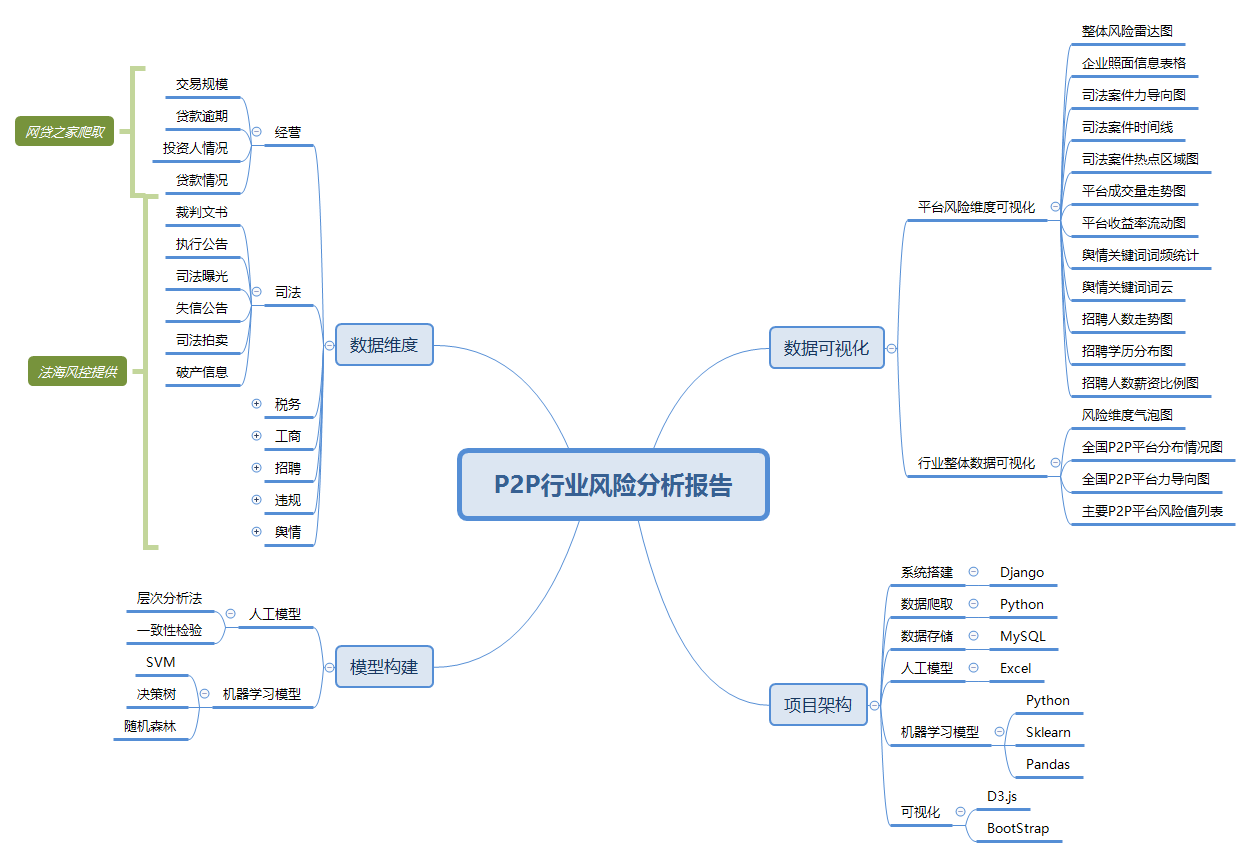
The system followed a classic data-to-dashboard pipeline: multi-source data collection, cleaning and storage in MySQL, parallel ML and AHP model construction, cross-validation between the two approaches, and a D3.js frontend served by a Django backend. The architecture was designed so each layer could be retrained or replaced independently as new data arrived.
Data Dimensions
We collected seven distinct risk dimensions for each platform. Judicial records came from court judgments, enforcement announcements, dishonesty listings, judicial auctions, and bankruptcy filings. Tax records covered abnormal taxpayer status, administrative penalties, tax arrears, and credit ratings (ABCD). Industry-and-commerce records included violations, abnormal operations, affiliation changes, and shareholder structure. Business metrics, transaction scale, and loan-default indicators came from Wangdaizhijia and the NIFA disclosure platform. Public-opinion data was scraped from WeChat, Weibo, and news apps; violation flags tracked ICP licensing and bank-custody status; recruitment data captured hiring volume and education distribution.
Model Construction
We split modeling into two tracks based on data quality. For the business dimension, where records were relatively complete, we trained ML models and selected the best performer. For non-business dimensions, which were sparse, discrete, and heavy with domain knowledge, we built a manual AHP model with consistency testing. The two tracks were then cross-validated against each other to offset the weaknesses of each.
Project Architecture
The architecture stacked four layers: data (crawling, cleaning, MySQL storage), modeling (ML classifiers plus the AHP expert model), a Django API layer that served JSON to the frontend, and a D3.js visualization website that rendered industry-wide and per-platform risk views.
Data Visualization
Visualization ran on D3.js, pulling JSON from the Django backend. The public view showed industry-wide bubble charts, a national platform distribution map, a force-directed guide map, and a ranked risk-value list. The per-platform view showed radar charts, enterprise profile tables, judicial case networks and timelines, transaction-volume and yield-rate trend charts, public-opinion word clouds, and recruitment distribution charts.
What Risk Signals Predict P2P Platform Failure?
We operationalized "risk" through seven dimensions and 30+ sub-dimensions, each chosen because a sharp change in that signal historically preceded platform distress. The table below summarizes the dimensions; in practice, the judicial, business, and violation dimensions carried the most predictive weight in our models.
Risk Dimensions and Descriptions
| Dimension | Sub-dimension | Description |
|---|---|---|
| Litigation Information | Bankruptcy information, judicial auctions, dishonesty announcements, judicial exposure platform, execution announcements, court judgments | Litigation (judicial) information describes legal cases involving the enterprise, illegal activities being sued against it, and any judicial auctions or bankruptcy proceedings. Legal and compliant behavior is a necessary condition for stable development, whereas excessive litigation and serious violations indicate elevated enterprise risk. |
| Industry & Commerce Information | Serious violations, administrative penalties, abnormal operations, affiliated information, change information, public disclosure information | Industry and commerce information covers basic registration data such as capital, legal representative, and business scope. Abnormal changes or significant modifications signal anomalies. The project also tracks affiliated-party risk: outbound investments, subsidiaries, and the legal representative's other holdings. |
| Tax Information | Abnormal taxpayers, administrative penalties, tax arrears announcements, tax credit ratings (ABCD) | Tax information reflects whether an enterprise files and pays on time. Long-term tax arrears, tax-evasion exposure, or an abnormal-taxpayer designation by authorities indicates possible financial or funding problems and significant enterprise risk. |
| Business Information | Loan default conditions, transaction scale | Business data, drawn from Wangdaizhijia, Wangdaitianyan, and the NIFA disclosure platform, evaluates each P2P platform through quantitative indicators such as transaction scale and loan-default rates. |
| Public Opinion Information | News media | By crawling platform-related content from WeChat, Weibo, and news apps, we scored articles for risk keywords such as "fraud, withdrawal difficulties, defaults, inaccessible, terrible, opaque, falsification, self-financing, exposure, cannot connect, frequent changes" to gauge public-sentiment severity. |
| Violation Information | ICP certification, bank custody, central bank penalties, CBRC penalties | ICP certification is mandatory for any Internet business; a missing ICP record implies illegal operation. The 2016 Guidelines for Network Loan Fund Custody Business required all P2P platforms to complete bank custody, which separates firm funds from user funds and prevents direct misappropriation. A missing custody record raises risk. |
| Recruitment Information | Management education level, recruitment education distribution, number of positions and recruits | Recruitment data reveals team quality through education distribution, especially among management. A sudden spike in barrier-free hiring, or serious vacancies in management roles, is a strong risk signal. |
Project Credit Risk Rating Indicator System
The full AHP indicator hierarchy and per-indicator weights are documented in the project report. The system decomposes risk into the seven dimensions above, each weighted through pairwise comparison and consistency testing.
System Setup
- D3.js (frontend visualization)
- Python + Django (backend request handling)
- MySQL (backend database)
- Access port: 8000
How Was the Training Data Collected and Stored?
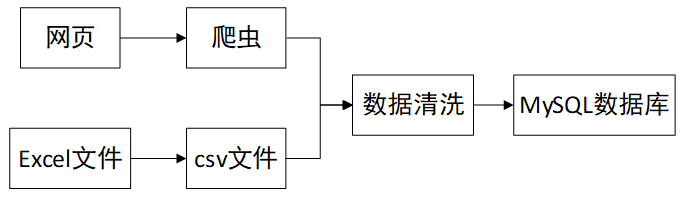
The project drew on two complementary sources: business metrics crawled from public P2P websites, and structured judicial, tax, industry/commerce, public-opinion, violation, and recruitment records provided by partner enterprises. Crawlers pulled the former; Python scripts cleaned and normalized both into CSV, then loaded everything into MySQL.
Data Extraction via Crawlers
Scrapy Framework
We built the crawlers with Scrapy, a fast Python framework for extracting structured data from websites at scale. It handled request scheduling, retries, and pipeline-based cleaning in one place.
Main Data Sources
Business data came from two industry sources. Platform transaction data was crawled from Wangdaizhijia, and operational metrics came from the China Internet Finance Association Registration and Disclosure Service Platform. Together they gave us total transaction amount, transaction count, financier and investor counts, project-default rate, and amount-default rate for each platform.

Data Acquisition
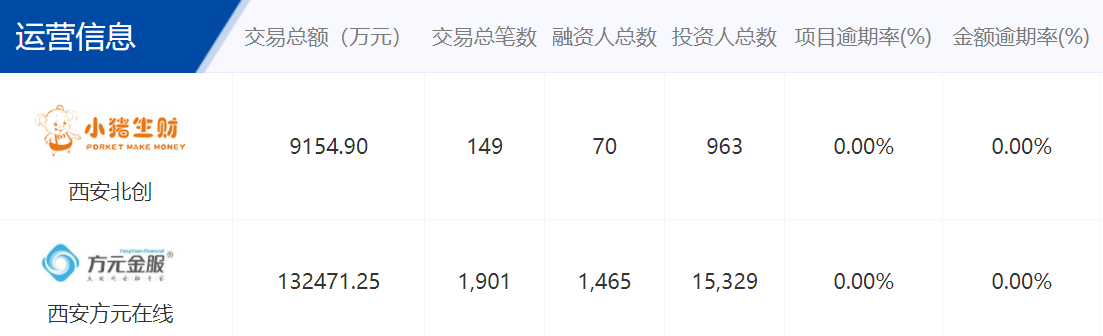
The NIFA disclosure platform loads its metrics dynamically, so we extracted numbers directly from the HTML source tags. The figure below shows how a platform's on-page transaction volume maps to the raw value we pulled.

For table-formatted sections, regular expressions pulled the numeric values.

For Wangdaizhijia, inspecting the page's JavaScript revealed the underlying JSON endpoint. We used Scrapy to simulate the form POST request and pull business metrics across time periods.

Database Storage of Crawler Data
Because the two disclosure platforms used different schemas, we built separate MySQL tables for each. The tables below define the columns we stored.
| Column Name | Meaning |
|---|---|
| bussinessInfo | Business data disclosed by the Internet Finance Association |
| platform_name | Platform name |
| end_time | Information cutoff date |
| trade_amount | Total transaction amount (10,000 CNY) |
| trade_total_number | Total number of transactions (transactions) |
| invest_total_number | Total number of investments (transactions) |
| financiers_number | Total number of financiers (people) |
| invester_number | Total number of investors (people) |
| repaid_amount | Amount to be repaid (10,000 CNY) |
| past_amount | Default amount (10,000 CNY) |
| project_past_rate | Project default rate (%) |
| amount_past_rate | Amount default rate (%) |
| project_past_number | Number of defaulted projects |
| average_financialer_amount | Average cumulative financing per person (10,000 CNY) |
| average_invest_amount | Average cumulative investment per person (10,000 CNY) |
| average_finacing_amount | Average financing amount per transaction (10,000 CNY) |
| top1_finacing_rate | Largest single-financier financing balance proportion (%) |
| top10_finacing_rate | Largest 10-financier financing balance proportion (%) |
| top1_invest_rate | Largest single-investor investment balance proportion (%) |
| top10_invest_rate | Largest 10-investor investment balance proportion (%) |
| project_past90_rate | Tiered project default rate (90 days) (%) |
| project_past180_rate | Tiered project default rate (91-180 days) (%) |
| project_past181_rate | Tiered project default rate (181+ days) (%) |
| amount_past90_rate | Tiered amount default rate (90 days) (%) |
| amount_past180_rate | Tiered amount default rate (91-180 days) (%) |
| amount_past181_rate | Tiered amount default rate (181+ days) (%) |
| history_project_past_amount | Historical project default amount (10,000 CNY) |
| history_project_past_rate | Historical project default rate (%) |
| total_past_amount | Total cumulative default-compensation amount (10,000 CNY) |
| total_past_number | Total cumulative default-compensation count (transactions) |
| bussinessInfoId | Unique transaction information identifier ID |
| Column Name | Meaning |
|---|---|
| wdzjInfo | Published business data from Wangdaizhijia |
| wdzjInfoId | Unique transaction information identifier ID |
| platform_name | Platform name |
| amount | Transaction volume (10,000 CNY) |
| incomeRate | Average reference yield (%) |
| loanPeriod | Average loan term (months) |
| regCapital | Registered capital |
| fullloanTime | Time to fully fund (minutes) |
| stayStillOfTotal | Outstanding balance (10,000 CNY) |
| netInflowOfThirty | Net capital inflow (10,000 CNY) |
| timeOperation | Operating time |
| bidderNum | Number of investors |
| borrowerNum | Number of borrowers |
| totalLoanNum | Number of loan listings |
| top10DueInProportion | Top 10 big investors' outstanding balance proportion |
| avgBidMoney | Per capita investment amount |
| top10StayStillProportion | Top 10 borrowers' outstanding balance proportion |
| avgBorrowMoney | Per capita borrowing amount |
| developZhishu | Development index ranking |
| currentLeverageAmount | Leveraged amount |
| startDate | Start date |
| endDate | End date |
| weightedAmount | Weighted amount |
| background | Background |
| newbackground | New background |
Processing Enterprise-Provided Data
Partner enterprises delivered judicial, tax, industry-and-commerce, public-opinion, violation, and recruitment records as Excel files. We converted each to CSV with Python, split on commas, and loaded the results into MySQL.
Database Table Structure
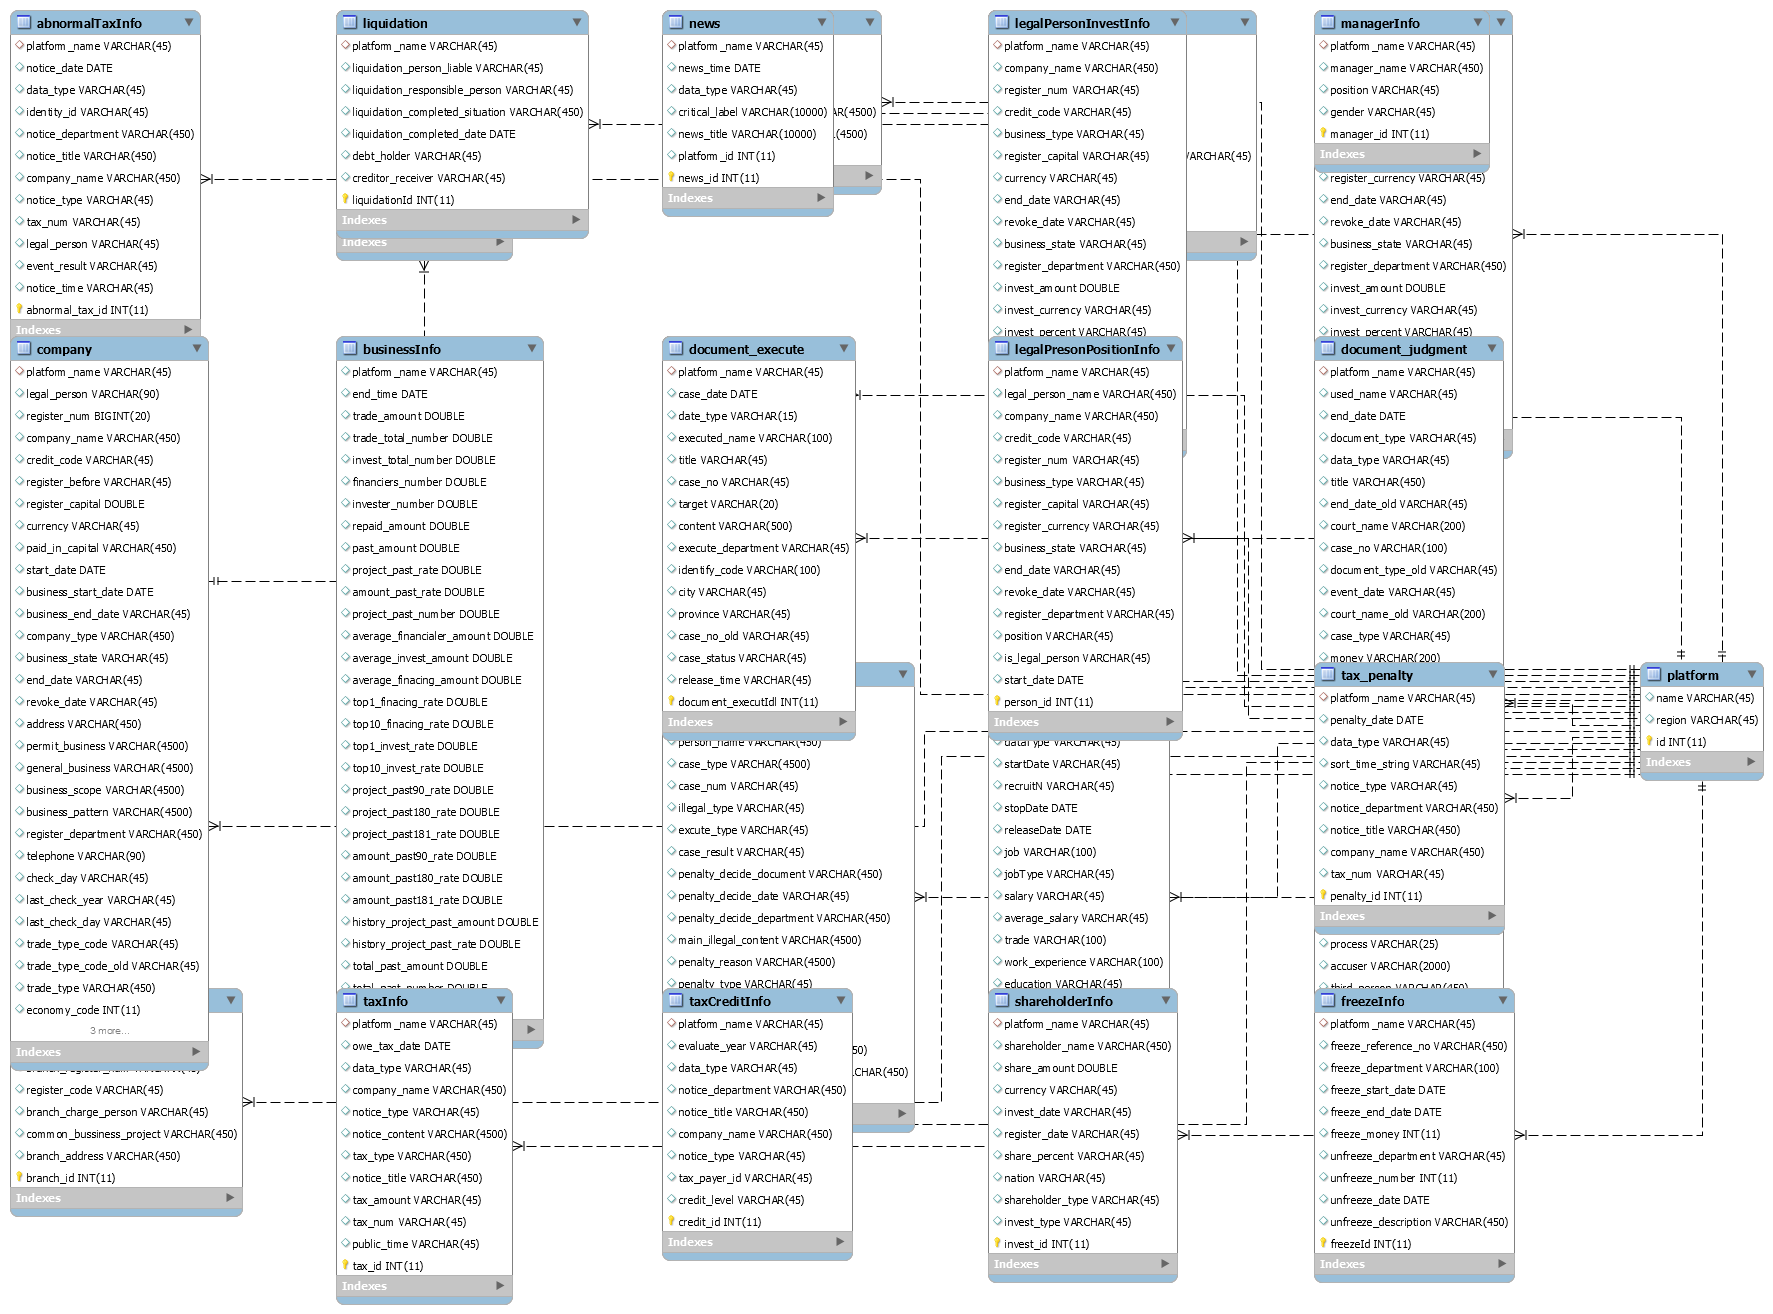
- The platform table stores each P2P platform's name and city; the platform name is the foreign key linking all other tables. The company table stores industry-and-commerce details for each platform's subsidiaries.
- Judicial dimension:
documentJudgmentanddocumentExecutetables store court judgments and enforcement announcements. - Industry and commerce dimension: tables for basic profiles, equity freezes, liquidation, administrative penalties, shareholders, management, legal-person investments and positions, change records, outbound investments, branches, and equity pledges.
- Tax dimension:
taxInfo,taxPenalty,abnormalTaxInfo, andtaxCreditInfotables store tax arrears, penalties, abnormal-taxpayer status, and credit ratings. - Public opinion dimension: the
newstable stores each platform's scraped news items, tags, titles, and content. - Recruitment dimension: the
employInfotable stores each period's job postings, salaries, benefits, and locations. - Business dimension:
businessInfoandwdzjInfotables store transaction volume, per-capita investment, and related metrics. - Violation dimension:
ICPandbankDepositorytables store ICP and bank-custody compliance flags.
Which ML Models Best Detect High-Risk P2P Platforms?
We framed risk detection as a binary classification problem: given a platform's recent behavior, predict whether it would become "problematic" (withdrawal difficulties, running away, or business suspension). After filtering, 352 platforms met the data-quality threshold, of which only 58 were problematic, a severe class imbalance we corrected with SMOTE oversampling. The SVM classifier performed best.
Data Source and Variable Selection
The training set covered all available data for 800+ platforms from 1 January 2015 onward. From each platform's basic information we selected eight indicators based on data availability: operating days, transaction volume, average interest rate, number of investors, average loan term, number of borrowers, cumulative outstanding amount, and number of loan listings. For each indicator we computed both the mean and the coefficient of variation (standard deviation divided by mean) over the observation window, yielding 16 features that capture both level and volatility.
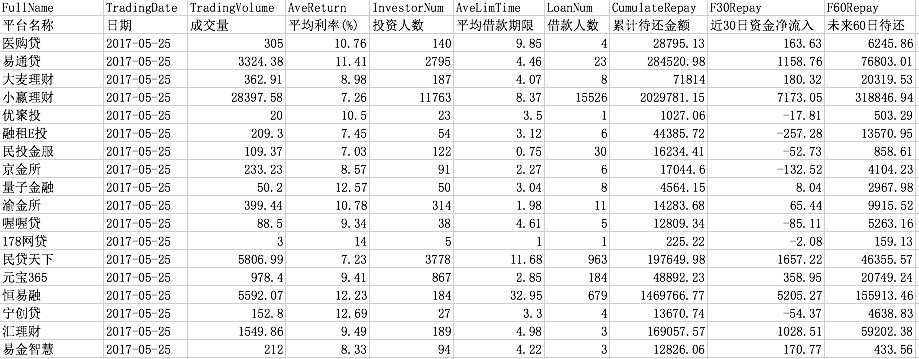
Problematic platforms identified on Wangdaizhijia were labeled 1; normal platforms were labeled 0.

Machine Learning Models
We evaluated three statistical models: random forest, decision tree, and SVM. Each was trained on the 16-feature set and evaluated with five-fold cross-validation. To address the roughly 6:1 imbalance between normal and problematic platforms, we applied SMOTE to oversample the minority class before training.
Result Analysis
| Model | AUC |
|---|---|
| Random Forest | 0.9333 |
| Decision Tree | 0.8484 |
| SVM | 0.9393 |
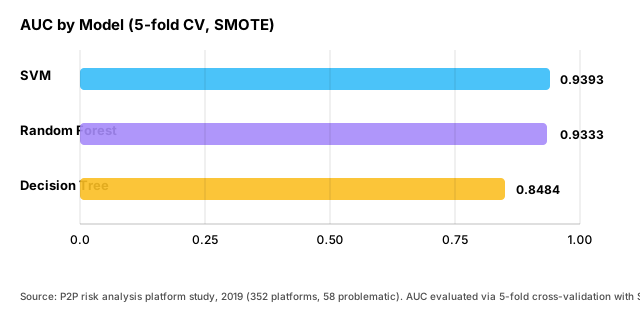
The SVM achieved the highest test-set accuracy at 94%, with random forest a close second at 93%. The decision tree lagged at 85%. The chart below visualizes the AUC comparison.
We also tried augmenting the business features with judicial, tax, and industry-and-commerce data, but accuracy dropped. Three factors explain this: the non-business data was text-heavy and discrete, unevenly distributed over time, and severely missing for many platforms. Because most business metrics came from Wangdaizhijia rather than official sources, their credibility is also lower than judicial or tax records, which motivated the parallel manual model.
Citation capsule: On 352 labeled P2P platforms (58 problematic), an SVM classifier trained on 16 business features reached 94% test-set accuracy and AUC 0.9393, outperforming random forest (93%, AUC 0.9333) and decision tree (85%, AUC 0.8484) under five-fold cross-validation with SMOTE oversampling.
Manual Modeling
For the non-business dimensions we built an Analytic Hierarchy Process (AHP) model: domain experts performed pairwise comparisons of indicator importance, we derived a weight vector, and we ran a consistency test to confirm the judgments were coherent. This produced an explainable, per-dimension risk score even where training data was too sparse for supervised learning.
Comparison of the Two Modeling Methods
Each approach covers the other's blind spot. Machine learning excels at binary classification, reliably answering "is this platform risky?" but it cannot produce a fine-grained risk value or rank relative risk across firms. The AHP model ranks platforms and pinpoints which dimension drives the risk, but its weights are subjective and less accurate on purely predictive tasks. By cross-validating the two, we got both a reliable risk flag and an explainable risk decomposition.
How Were Risk Results Visualized?
We built a D3.js dashboard served by Django so users could query any platform's risk profile. The frontend requested data over AJAX; the backend returned JSON; D3 rendered it as interactive charts. The combination of a radar chart and a sector chart became the signature view for communicating overall risk at a glance.
Website Architecture
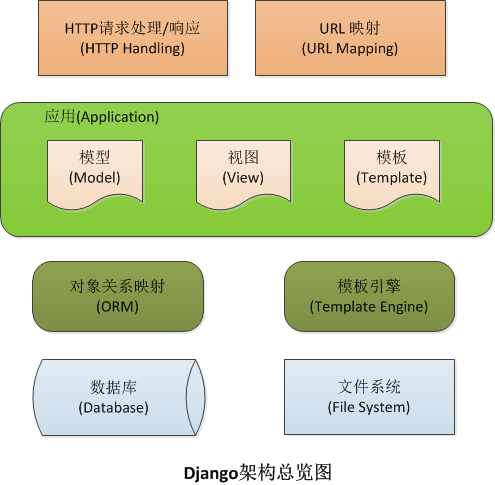
The backend Django server receives POST and AJAX requests, dispatches them through a controller to the appropriate processing module, queries MySQL through Django's ORM, runs the relevant model, and returns JSON. The frontend parses the JSON and renders it with D3.js.
Web Page Display
Website Homepage
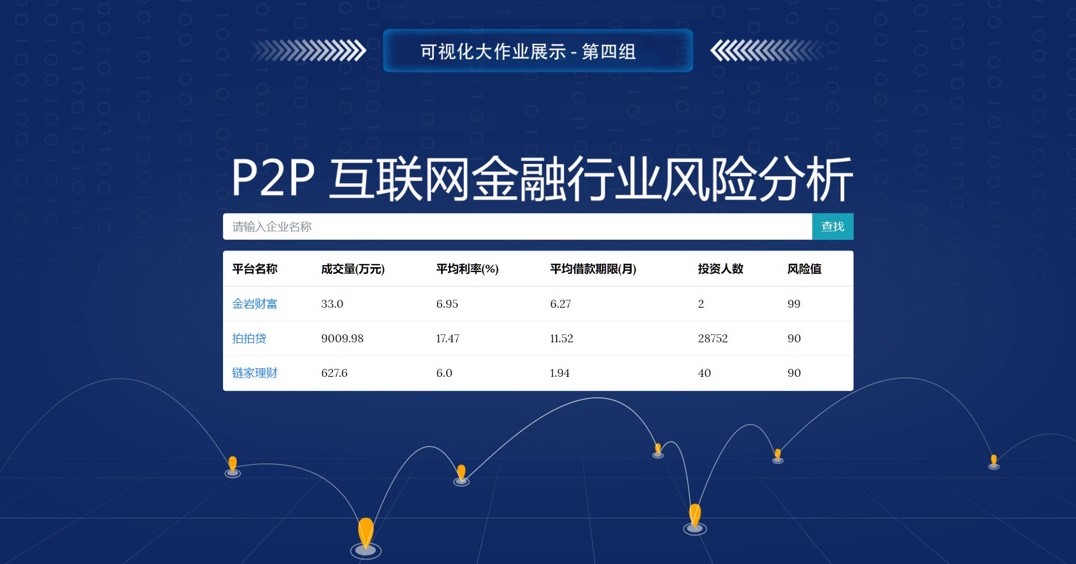
By default the homepage shows the three platforms with the highest risk values; users can search for any target enterprise.
P2P Enterprise Regional Distribution Heatmap
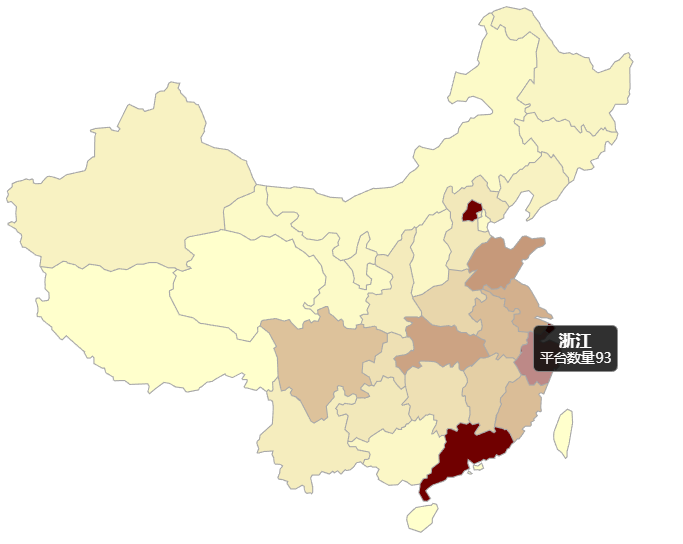
The heatmap makes the geographic concentration obvious: P2P platforms cluster in Beijing, Shanghai, Guangdong, Jiangsu, and Zhejiang.
Overall Risk Analysis for an Enterprise
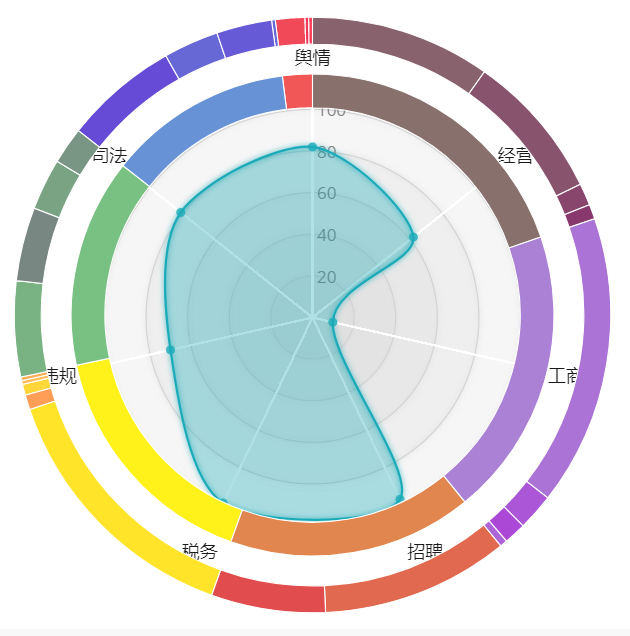
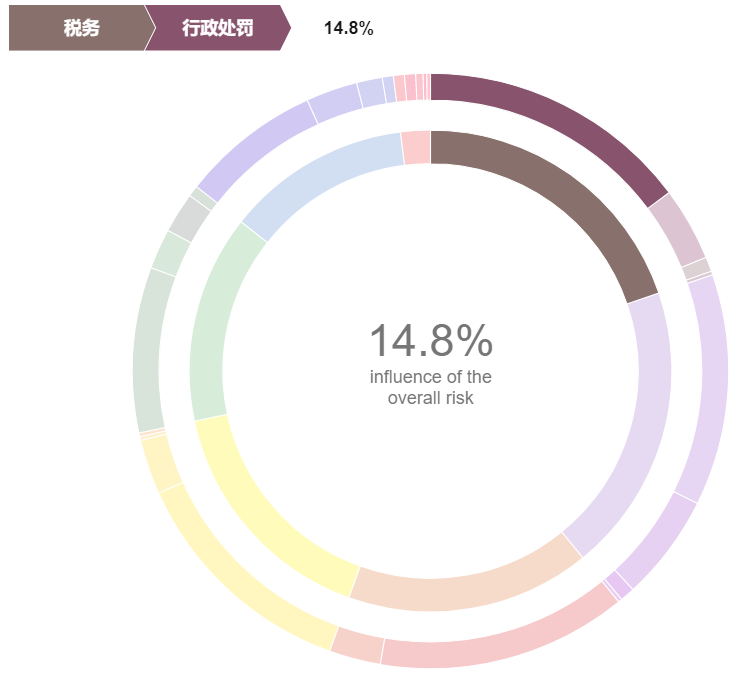
A radar chart plus a sector chart communicates both the absolute risk across the seven dimensions and each dimension's share of the total. The frontend toggles between the two views using the visibility property on a div tag.
Industry & Commerce Dimension Risk Overview for an Enterprise
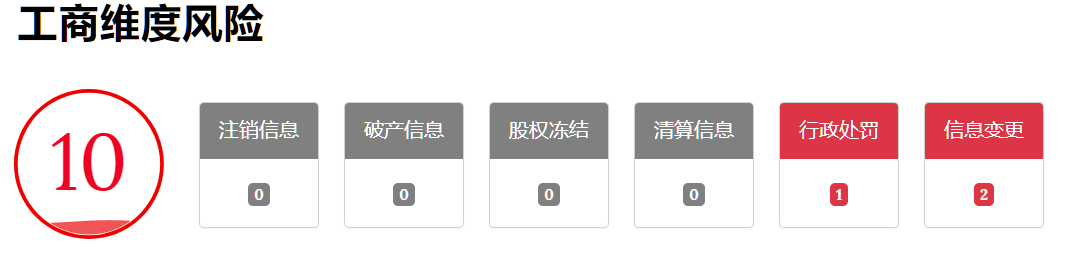
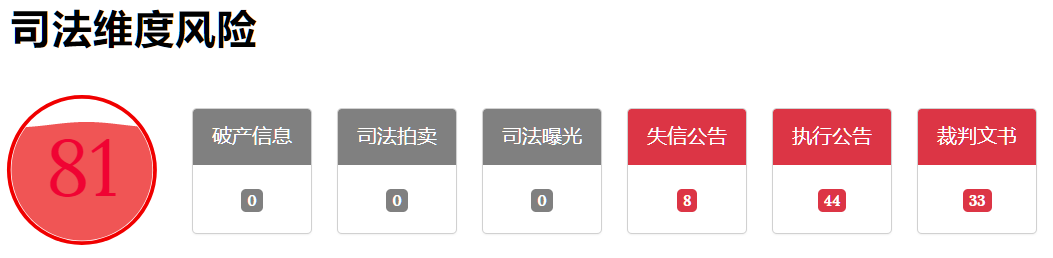
Each of the seven dimensions has its own risk value, drawn as D3 circles animated with transform and translate.
Judicial Dimension Case Relationship Network for an Enterprise
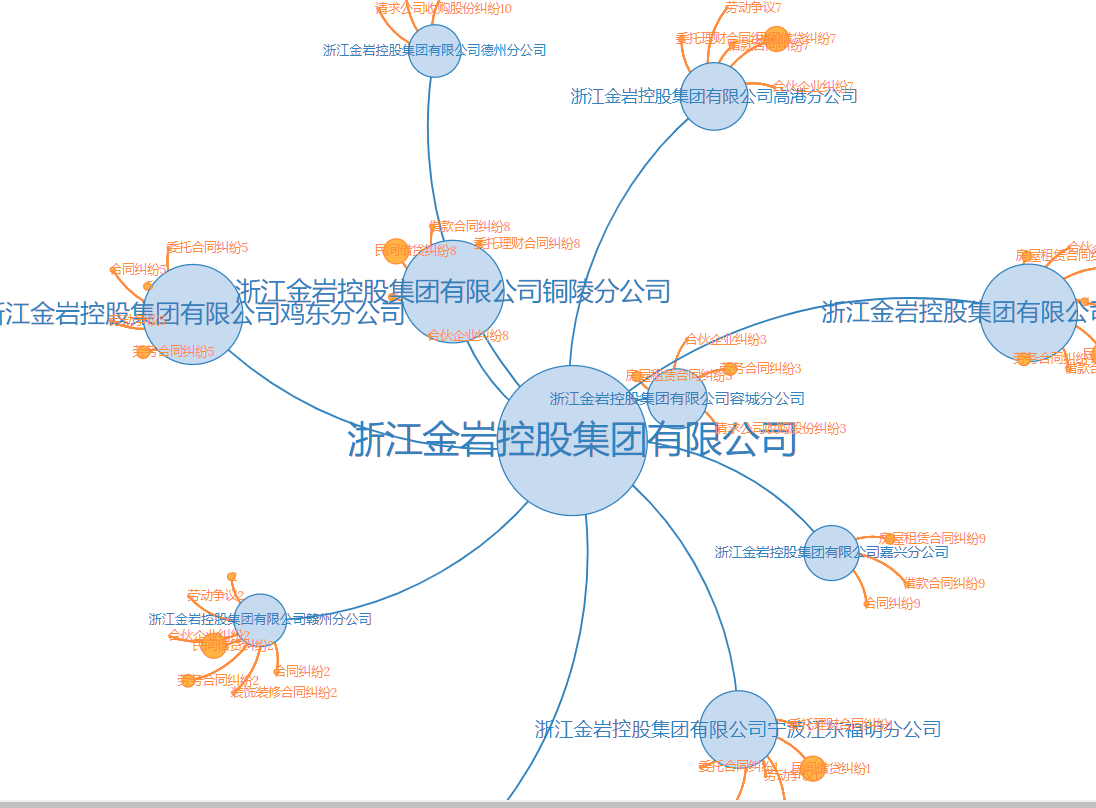
D3's force layout renders the number and relationships of all legal cases involving the company and its subsidiaries.
Transaction Volume and Interest Rate Change Charts for an Enterprise
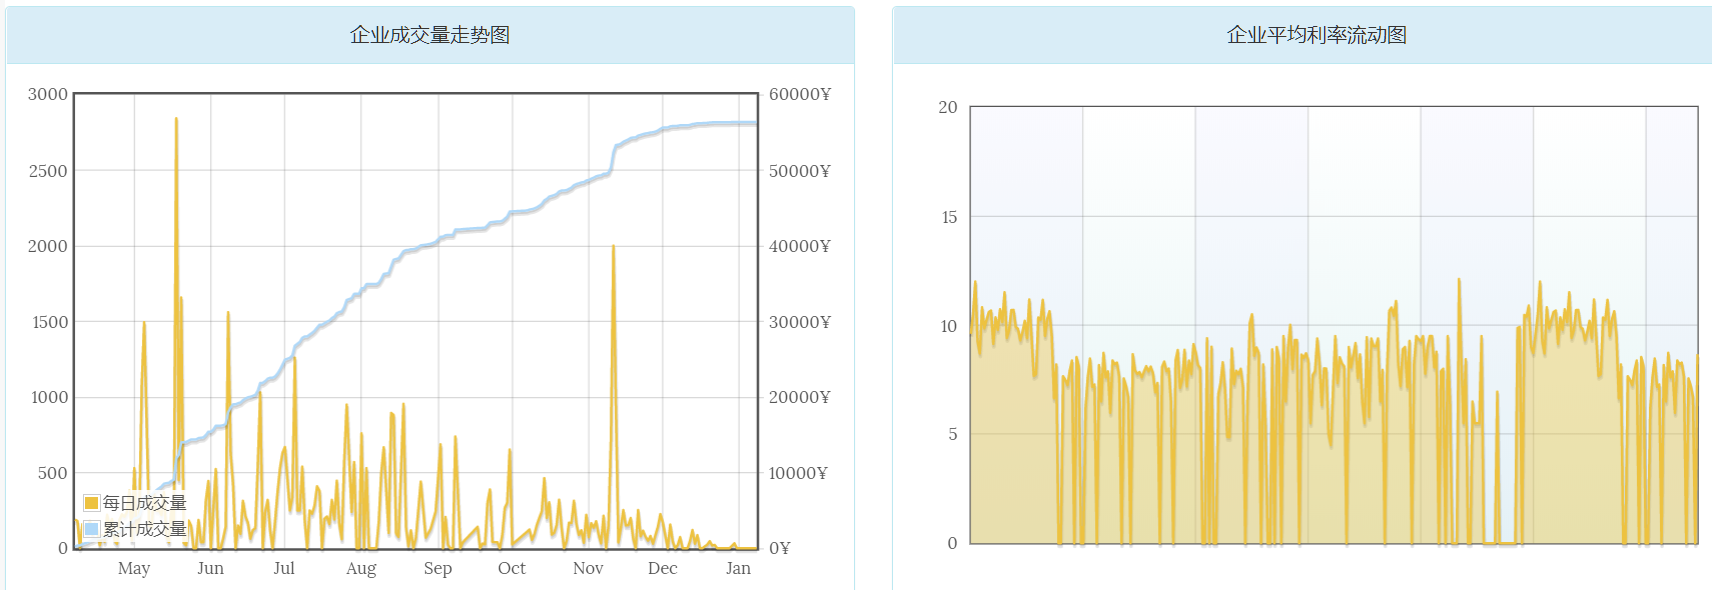
These two trend charts reveal operational health. In the example above, transaction volume falls sharply toward zero, a strong near-term risk signal.
Word Cloud Display in the Public Opinion Dimension for an Enterprise
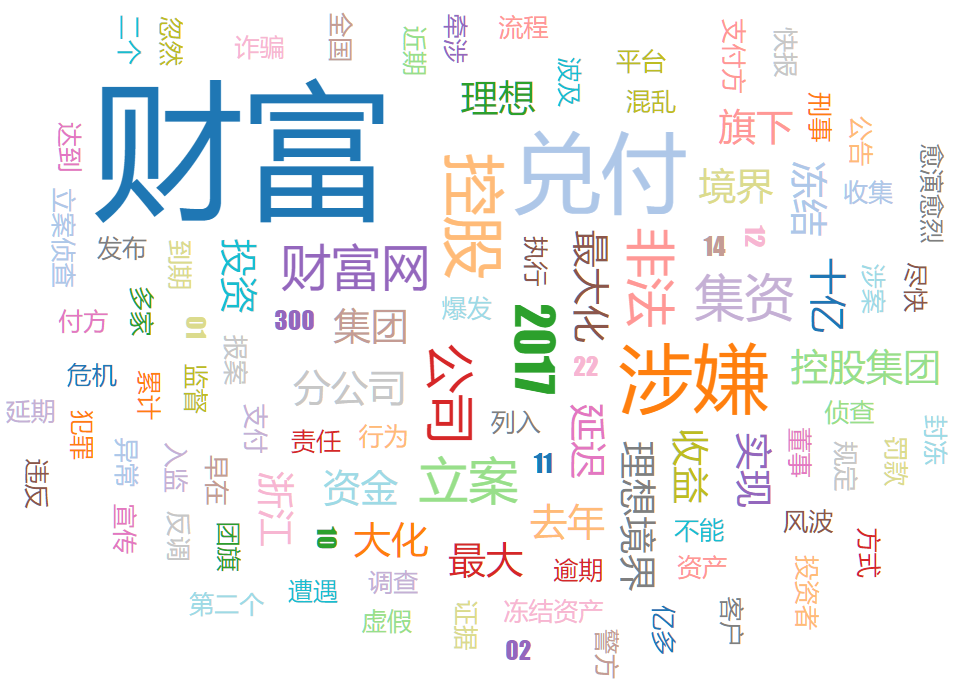
After scraping and segmenting public-opinion text, we render keyword frequency as a word cloud using the open-source D3 layout d3.layout.cloud.js.
Recruitment Number Proportion Chart under the Recruitment Dimension for an Enterprise
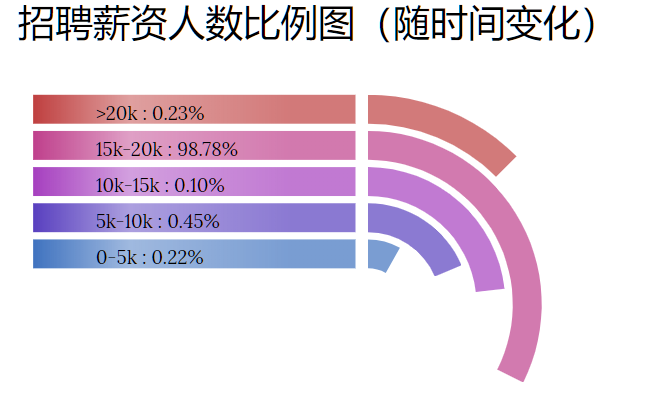
A modified sector chart that cycles through recruitment events on a timer, showing the distribution of each hiring type.
Recruitment Number Trend Chart and Recruitment Education Distribution Chart under the Recruitment Dimension for an Enterprise
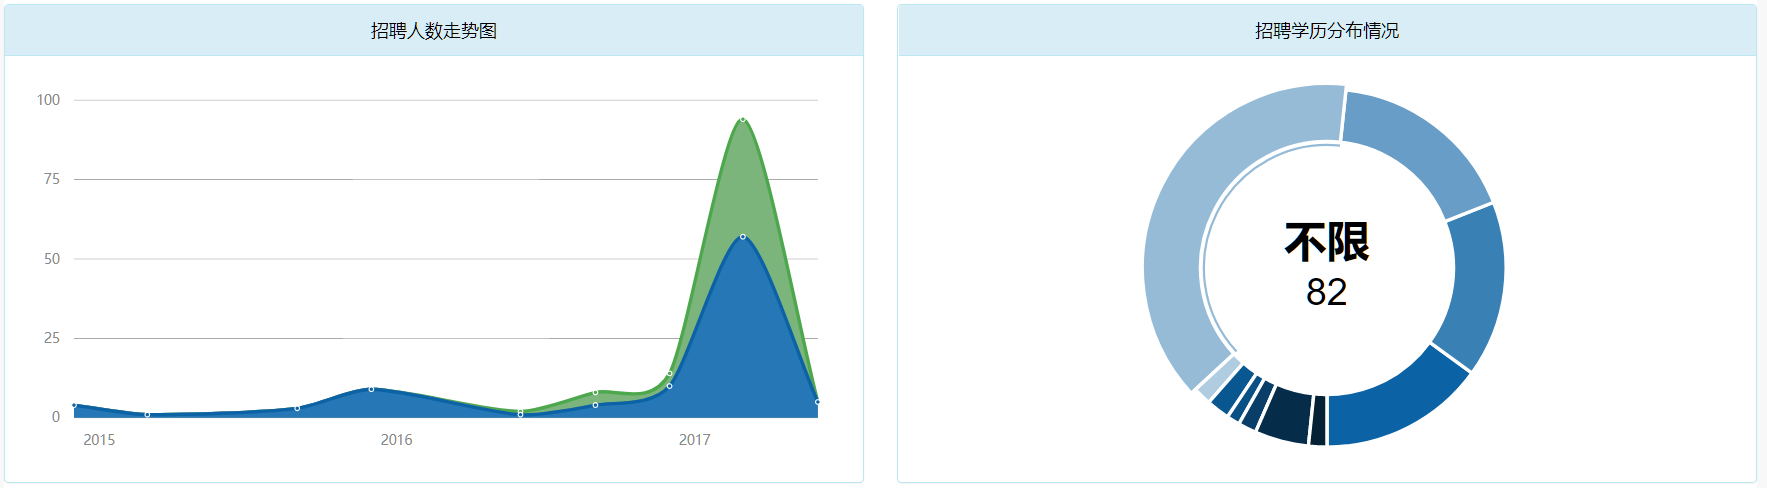
The example shows a sudden wave of large-scale, low-education hiring around mid-2017, a strong risk signal that preceded the platform's failure.
Frequently Asked Questions
Why combine machine learning with a manual AHP model instead of using one or the other? ML gives a reliable binary flag but no explanation and no relative ranking. AHP gives an explainable, per-dimension score but relies on subjective weights. Cross-validating the two let us flag risky platforms accurately while still showing users which dimension drove the score. On our 352-platform dataset, the SVM alone reached 94% accuracy, but the AHP decomposition was what made the output actionable for supervisors.
Which risk dimensions mattered most for prediction? Business metrics (transaction volume, default rates, investor counts) carried the most predictive signal and were the only features in the final ML model. Judicial and violation flags were strong risk markers but too sparse and discrete to improve classifier accuracy when added. In the AHP model, litigation and business dimensions received the highest expert-assigned weights.
Why did adding judicial, tax, and industry data reduce ML accuracy? Three reasons: the data was text-heavy and discrete rather than numeric, unevenly distributed over time, and severely missing for many platforms. Sparse, noisy features added more signal degradation than signal, so we kept the classifier on the 16 business features and handled the non-business dimensions through AHP instead.
What happened to China's P2P lending industry? Regulators shut the industry down between 2019 and 2021, closing or forcing out thousands of platforms. This project, completed in early 2019, captures the final years of that market. We publish it as a reproducible ML case study, not as current industry guidance.
Does this approach transfer to other domains? Yes. The pipeline, multi-source feature engineering, SMOTE for class imbalance, and hybrid ML-plus-expert-model validation, applies to credit scoring, fraud detection, insurance underwriting, and any setting where you need to rank entities by risk. The visualization patterns (radar charts, force-directed case networks, trend charts) transfer directly.
Sources
- China Internet Finance Association (NIFA), Registration and Disclosure Service Platform, https://dp.nifa.org.cn/
- Wangdaizhijia (WDZJ), P2P lending industry data, https://www.wdzj.com/ and http://shuju.wdzj.com/
- D3.js, data-driven visualization library, https://d3js.org/
- Reuters, coverage of China's P2P lending crackdown, 2020, https://www.reuters.com/