No D3, No Chart Library: Building a Force-Directed Graph and Metro Map from Scratch
Introduction
The first version of the Shanhaijing site had one data file, and every page fetched it. /shanhaijing/data.json weighed 6,474,522 bytes — 6.2 MB of JSON, 302 KB of it gzipped. The panorama page downloaded all of it to draw 26 mountain chains. The mountain-focus view downloaded all of it to show one mountain. And the hub page downloaded all of it to display fifteen numbers: the count of entities in each of fifteen types.
Nothing crashed. The site worked. It was just slow in a way that felt like a design flaw rather than a bug, because it was one: a single 6.2 MB blob is a fine build artefact and a terrible runtime API.
Fixing it turned into a front-end engineering project with three parts. Splitting the monolith into six per-view files. Moving the expensive geometry out of the browser and into the build. And — the part I actually want to write about — writing the two visualizations by hand, in TypeScript and SVG, with no D3, no cytoscape, no chart library of any kind.
This post is the engineering story. It assumes you know what a force-directed layout is and would like to know what happens when you implement one yourself, why the Fruchterman-Reingold constants matter, how a metro map can be derived from the phrase "three hundred li further east," and where the "no dependencies" argument is honest and where it is marketing. The data side of the project is covered in the knowledge-graph pipeline post; the overview of what the site actually contains is the hub post.
Key Takeaways
- Zero chart dependencies. The full force-directed graph — 300-iteration Fruchterman-Reingold layout, component packing, label collision — is 9.7 KB gzipped.
- 6.2 MB became 539 KB. Splitting
data.jsonper view cut the panorama's first-paint payload 8.8×.- The metro map is deterministic. All 26 chain layouts are precomputed at build time.
- 25.6 KB covers 50 unrenderable characters. A BabelStone Han Extension B subset supplies 𪁺 (U+2A07A), missing from Noto Serif CJK SC.
- Size is not the real argument. d3-force is only 3.0 KB gzipped; the reason to hand-write was control.
What Does output: 'export' Actually Forbid?
It forbids the server. The site is a Next.js 14 App Router project built with output: 'export', trailingSlash: true and images: { unoptimized: true }, which produces a directory of static files with no Node process behind it (Next.js, 2026). No route handlers, no server actions, no on-demand rendering, no image optimization service, no /api/*.
That single constraint cascades through every design decision in this post. Three consequences mattered.
First, anything dynamic has to be either prerendered or fetched. The Shanhaijing site ended up with both. The 2,141 entity pages are prerendered HTML — the build reads data.json from disk and emits one page per entity. The five interactive views (panorama, mountain focus, knowledge graph, search, chapter reader) are client components that fetch a static JSON file and render into SVG in the browser. There is no third option: no endpoint can compute a layout on request.
Second, static export means the JSON files are the API. They live in public/, they are served verbatim, they are cached by the CDN, and their size is a first-paint cost paid by every visitor. There is no query language, no field selection, no pagination. If a view needs 12% of the data, and the file contains 100%, the browser downloads 100%. That is the entire justification for the file split I describe later.
Third, prerendered HTML is the only content that non-JavaScript crawlers see. The interactive views render into an empty <div> and fill it in with JavaScript, so GPTBot and ClaudeBot get nothing from them. The parts of the site that need to be citable — entity pages, chapter pages, the hub — are therefore generated as complete HTML at build time. This is a real trade-off, not a free win, and it is why the site has 2,141 static entity pages instead of one fast client-side entity browser.
A citation-ready summary of the constraint: because the site is a static Next.js export with no route handlers, all data must ship as static JSON and all citable content must be prerendered — which is why 2,141 entity pages, 15 type pages and 19 chapter pages are generated at build time from a 6,474,522-byte data.json (project data, 2026).
Why Write a Force-Directed Layout by Hand?
Because the layout is the easy part, and everything around it is not. The Fruchterman-Reingold algorithm is roughly forty lines of arithmetic; the other 580 lines of src/lib/shanhaijing-graph.ts are graph construction, balanced truncation, connected-component separation, label collision and the four filter operations the UI needs. A library would have given me the forty lines and left me writing the rest anyway — against someone else's data model. The default view renders 179 nodes and 250 edges, and it is 100% hand-written TypeScript.
Here is what the forty lines actually do.
Fruchterman-Reingold in 300 iterations
The algorithm treats the graph as a physical system. Every pair of nodes repels; every edge pulls. Both forces are functions of a single length constant k, the "ideal edge length":
k = sqrt(canvas_width × canvas_height / node_count)
For the default canvas of 1400 × 900 with 200 nodes, k = sqrt(1400 × 900 / 200) = 79.4 units. Repulsion between two nodes at distance d is k² / d; attraction along an edge at distance d is d² / k. The asymmetry is the whole trick: repulsion falls off with distance, so distant nodes barely interact, while attraction grows with distance, so stretched edges pull hard. The equilibrium sits near k.
Three constants keep it from exploding:
- Temperature. Initial temperature is
min(width, height) / 10= 90 units, cooled linearly by90 / 301 = 0.299per iteration, floored at 0.5. No node can move further in one iteration than the current temperature, so the first iterations are exploratory and the last ones are micro-adjustments. - Gravity. Each iteration adds a pull toward the canvas centre scaled by
0.1. Without it, disconnected components drift off-canvas and the finalviewBoxbecomes meaningless. - A degeneracy guard. When two nodes land within 0.01 units of each other, the repulsion direction is replaced with a random jitter. Dividing
k² / dby a near-zerodproduces an infinity that poisons every subsequent position; the guard costs one comparison and prevents a class of spectacular failures.
// repulsion: f = k²/d  — every pair, both directions
const d = Math.sqrt(d2)
const f = (k * k) / d
a.vx += (dx / d) * f;  a.vy += (dy / d) * f
b.vx -= (dx / d) * f;  b.vy -= (dy / d) * f

// attraction: f = d²/k — along each edge only
const f2 = (d * d) / k
a.vx += (dx / d) * f2;  a.vy += (dy / d) * f2
b.vx -= (dx / d) * f2;  b.vy -= (dy / d) * f2
The repulsion loop is O(n²) per iteration — 19,900 pair computations for 200 nodes, times 300 iterations — so a single layout is roughly 6 million distance evaluations. On this machine, in Node, a full 300-iteration run of the default graph takes 24 ms; the first run in a fresh process takes 39 ms including JIT warm-up. In a browser it is slower, which is why the component defers the computation behind a setTimeout(…, 40) so the loading state paints before the main thread blocks.
The three passes that make it readable
Raw Fruchterman-Reingold produces an unreadable hairball for a graph like this one, because the Shanhaijing graph is not connected. It is one dense cluster of mountains and minerals, a medium water network, and a long tail of two- and three-node fragments. Three post-processing passes fix that.
1. Balanced truncation before layout. The graph has 1,350 candidate nodes under the default relation types, so the 200-node budget has to be spent deliberately. Naive top-degree truncation would fill the whole budget with mountains and minerals, because produces edges dominate. Instead the code computes each node's degree within each relation type and reserves ceil(200 / active_types) = 40 slots per type, then fills any remainder by overall degree. Without that, the creature nodes would never appear — they have far fewer edges than the mineral nodes, and the graph would lose the thing people actually came for.
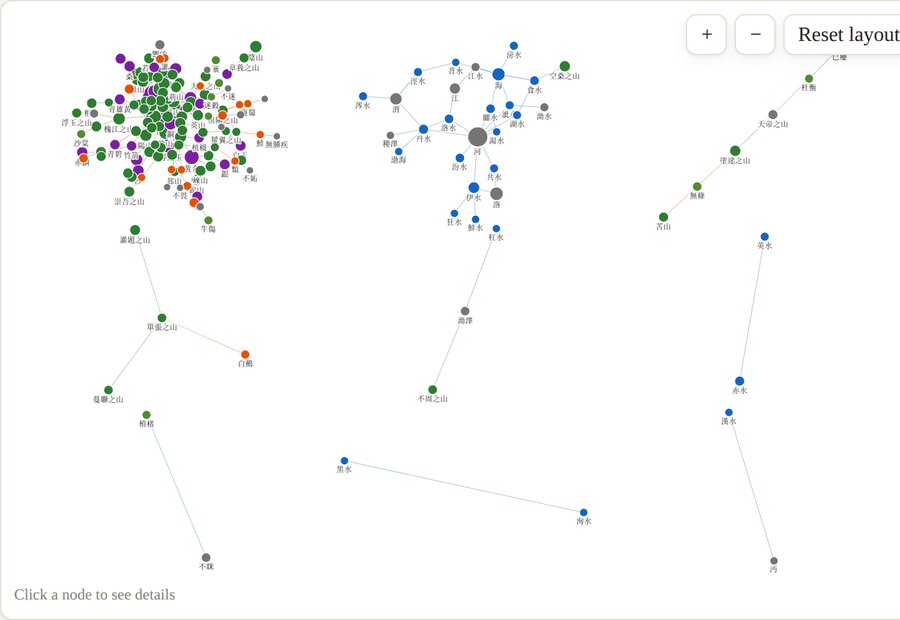
2. Connected-component separation. After the simulation converges, a BFS over the edge list partitions the nodes into components, sorts them largest-first, and packs them into a grid of cells (pad = 48, cols = ceil(sqrt(component_count))). Each component is then scaled to fit its cell and centred inside it. This is what turns a lopsided blob into the readable three-region layout you can see in the screenshot below.
3. Label collision detection. Node labels are rectangles — label.length × 11 pixels wide by 14 tall, anchored below the node — and placing all 200 of them is a dense-rectangle problem. The code sorts nodes by descending radius and greedily places each label if it does not intersect an already-placed one, with one override: nodes with radius ≥ 12 (degree ≥ 25, the genuine hubs) always get their label, collision or not. The result on the default graph is 83 of 200 labels shown, which is the honest number: a third of the graph is labelled, and the labels that survive are the ones on the biggest nodes.
The bug I found while writing this post
While measuring the layout for this article I noticed the UI reports 179 nodes, not the 200 the truncation is supposed to keep. The reason is a small leak in the interaction between truncation and filtering.
Balanced truncation decides which nodes to keep using per-relation-type degree ranks. But an edge is only emitted if both endpoints survive. So a node can be selected on the strength of its rank inside adjacent_to while every one of its neighbours gets truncated away, leaving it with zero edges in the built graph. The client then calls filterByRelationType, which keeps only nodes that appear in the filtered edge list, and drops the isolates. Twenty-one of the two hundred selected nodes end up orphaned this way — 蒼玉 (kept for produces), 䃌山 (kept for adjacent_to), 毒魚 (kept for has_efficacy), and eighteen others. It is not a crash and not a wrong answer; it is a 10.5% shortfall between the node budget and what the reader sees. The fix is a closure pass — after truncation, drop nodes with no surviving edges and re-fill the budget — and it is on the list.
How Do You Turn "Three Hundred Li Further East" into a Metro Map?
You accumulate vectors and then flatten the result. The Shan Jing describes each mountain's position relative to the previous one with a direction and a distance — 又東三百里, "three hundred li further east." That is already a vector. Sixteen direction strings (东, 东南, 东偏南, 北偏西 and so on) map to 16 unit vectors in DIRECTION_VECTORS, and each mountain's raw position is the running sum of direction × distance_li. The longest chain, 中次十一經, has 48 mountains, and its accumulated path is what you see in the figure below.

The raw accumulation is unusable as a drawing, for two reasons. Distances range from a few li to several thousand, so a linear scale puts 40 stations on top of each other and one station 900 pixels away. And the vertical component is nearly always zero, because most entries say "east" or "west," which would produce a perfectly flat line with no visual structure at all.
Two normalisations fix both problems. Horizontally, the chain is rescaled so that the minimum spacing is at least MIN_NODE_SPACING × (n − 1) = 24 × 47 = 1,128 units wide — the drawing is stretched to fill the width regardless of the declared distances, which is exactly the licence a metro map takes with real geography. Vertically, the whole chain is squashed into MAX_Y_OFFSET = 60 units, so a chain that accumulated 4,000 li of vertical drift still reads as a horizontal line with a hump in it rather than a diagonal.
Cluster detection, then uniform distribution, then push-apart
Even after normalisation, stations collide. Two mountains 40 li apart are, after scaling, fractions of a pixel apart. The collision resolver runs up to 500 rounds of two operations.
Cluster resolution builds a proximity graph: any two nodes closer than COLLISION_DIST = 24 units are linked, and a BFS finds the connected clusters. Each cluster of two or more is then redistributed uniformly along a horizontal run of (cluster.length − 1) × 24 units centred on the cluster's centroid, with alternating ±8-unit vertical offsets so adjacent stations are visually distinguishable. The nodes are reordered by their sequence number first, so the redistribution never scrambles the route order.
Push-apart handles the leftovers: for any pair still closer than 24 units, each is moved half the overlap distance along the line connecting them. This is the pass that catches clusters created by the previous pass — pushing one group apart can shove its last node into the next group's first node.
The loop exits when neither pass reports any movement, or after 500 rounds. For all 26 chains, the whole thing takes 10.0 ms in Node; the 48-mountain chain takes 0.55 ms on its own. It is fast because the chains are small — the average is 17.2 mountains, and the largest is 48 — and because the cluster pass converges in a handful of rounds rather than 500.
The final touch is a hard clamp: no node may sit left of PADDING_X = 60, because uniform redistribution is symmetric around a centroid and can push the leftmost station of a dense cluster off the canvas.
A citation-ready summary of the layout: the metro-map panorama converts each mountain's "direction + distance" phrase into a unit vector scaled by its li count, accumulates the vectors along the chain, rescales so the chain spans at least 1,128 units, flattens the vertical axis to 60 units, then resolves collisions by proximity-cluster redistribution plus iterative push-apart — 10.0 ms for all 26 chains (project data, 2026).
Why Precompute the Layout at Build Time?
Because a static site can, and because the alternative is doing the same arithmetic in every visitor's browser on every interaction. scripts/build-shanhaijing-data.mjs runs layoutChain for all 26 chains during the build and writes the resulting node coordinates into public/shanhaijing/panorama-layout.json — 187,347 bytes raw, 12.0 KB gzipped. The client component reads those coordinates and renders them; it only falls back to calling layoutChain at runtime if the precomputed file is missing.
The same pattern applies to the mountain-focus view's search index. buildCtx flattens 447 stations and builds four lookups: byName (419 entries), chainIndex (69), creatureIndex (202) and the flat station array. Those are Map objects in TypeScript, which are not JSON-serialisable, so the build converts them to plain objects with Object.fromEntries, writes them into map-data.json under a ctx key, and the client reverses the conversion with new Map(Object.entries(...)). The deserialiser returns null on any shape mismatch, and the component falls back to buildCtx — a two-line graceful degradation that meant the change could ship without a flag day.
There is a subtler reason to prefer build-time computation here, and it is not performance.
Determinism. forceDirectedLayout seeds its initial node positions with Math.random(). That is fine for an exploratory graph — press "Reset layout" and you get a new arrangement, which is arguably a feature — but it would be a disaster for the panorama. A metro map whose stations move every time you switch chains is not a map. Freezing layoutChain output into JSON means every reader, on every device, in every session, sees the same 26 lines. The coordinates become part of the data, not part of the render.
Payload. This is the real win, and it is the subject of the next section.
What Did Splitting One 6.2 MB File into Six Actually Buy?
It cut the panorama view's payload by 8.8× and the map view's by 8.8×, and it did almost nothing for the two views that genuinely need most of the data. That is the honest summary, and the chart below is deliberately arranged so you can see both halves of it.
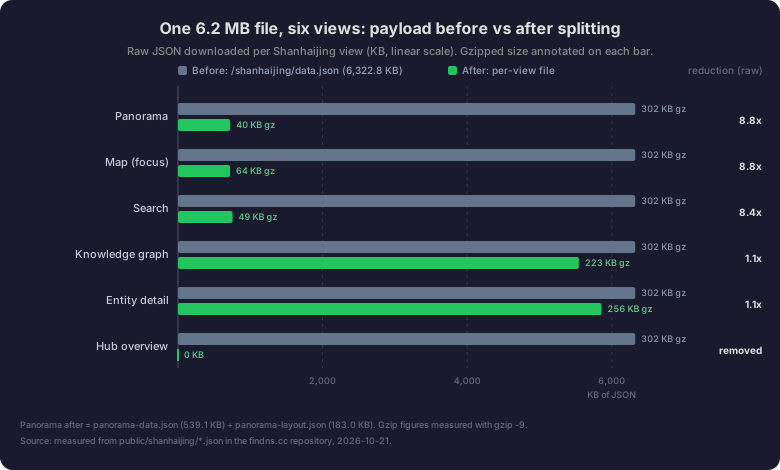
The split is by consumer, not by data type, and that is the whole design. Six files:
| File | Raw | Gzipped | Who fetches it |
|---|---|---|---|
panorama-data.json |
539.1 KB | 28.4 KB | Panorama view |
panorama-layout.json |
183.0 KB | 12.0 KB | Panorama view (precomputed coordinates) |
map-data.json |
720.9 KB | 64.3 KB | Mountain-focus view (includes the serialised search index) |
search-data.json |
755.5 KB | 48.7 KB | Scoped search |
graph-data.json |
5,543.7 KB | 222.8 KB | Knowledge graph (entities + all relations) |
entity-data.json |
5,856.3 KB | 256.2 KB | Entity detail pages |
meta.json |
0.4 KB | 0.2 KB | Overview pages, SEO |
Three things are worth pointing out.
The gzip ratios are absurd, and that changes the argument. JSON full of repeated Chinese entity names and repeated key names compresses to 4–9% of its raw size: the 6.2 MB monolith is 302 KB over the wire, and graph-data.json is 222 KB. So the network saving from the split is real but modest — 302 KB down to 40 KB for the panorama, not 6.2 MB down to 539 KB. The parse saving is the one that scales with device class: 18.4 ms of JSON parsing in Node and 7.2 ms in Chromium, on the main thread, before any layout can start. Removing 5.6 MB of parsing from a mid-range phone is worth more than the bandwidth.
The hub page now fetches nothing at all. The overview page used to download the full 6.2 MB file to compute fifteen numbers. Those numbers are now a frozen TypeScript constant, ENTITY_TYPE_COUNTS, in src/lib/shanhaijing-data.ts, with a comment stating they are generated from data.json and must be kept in sync. The entities index page was changed the same way. That is the single largest win in the whole refactor: 6.2 MB to zero, achieved by admitting that a number that changes once per build does not belong in a runtime fetch.
Two views did not improve, and I am not going to pretend otherwise. graph-data.json is 5.5 MB because the force-directed graph genuinely needs all 2,141 entities and all 7,113 relations to build its 200-node subset. entity-data.json is 5.9 MB because entity pages need the taxonomy, the aliases, the disambiguation records and both relation sets. The right fix for those two is not splitting but projection — emitting a pre-truncated 200-node graph and a per-entity relation slice — and that is a larger change than this refactor was.
One more small thing that mattered: the hub page emits <link rel="prefetch" href="/shanhaijing/panorama-data.json" as="fetch">, so the 539 KB panorama payload starts downloading while the reader is still looking at the overview. On a static site you have no server-side hints to give, but you do control the HTML, and a prefetch hint is the cheapest latency win available.
How Do You Render Characters That No Font Has?
You subset a font that has them, and you gate it behind unicode-range so nobody pays for it unless they need it. The Shanhaijing needs 50 CJK Extension B ideographs that the project's primary font cannot draw. The most notorious is 𪁺 (U+2A07A), which appears in the Southern Mountains chapter at 基山, where the text names a bird called 𪁺𩿧 — three heads, six eyes, six feet, three wings, and eating it cures drowsiness. Noto Serif CJK SC has a 44,777-codepoint cmap that includes 2,057 Extension B characters, and it does not have this one. Nor does it have 𩿧 (U+29FE7): 48 of the 50 ideographs the project needs are missing from its cmap.
The fix is a 26,196-byte WOFF2 subset of BabelStone Han containing exactly 159 codepoints: 95 ASCII, 14 typographic and CJK punctuation marks, and the 50 Extension B ideographs the text needs. The full BabelStone Han WOFF2 is 7,438,036 bytes, so the subset is 0.35% of it.
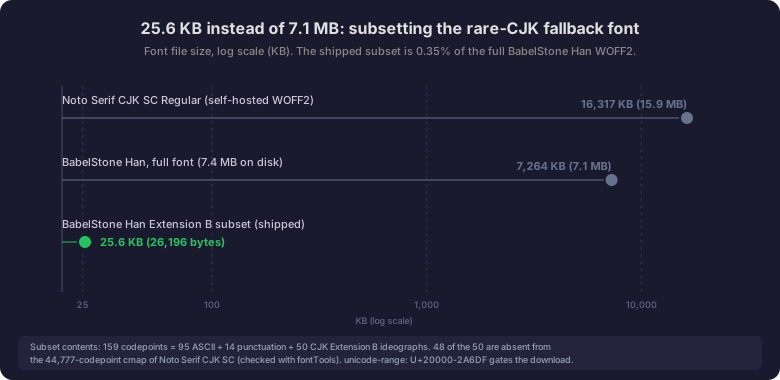
The interesting part is the gating. src/app/fonts.css declares the fallback with unicode-range: U+20000-2A6DF, and the primary font's own @font-face rules explicitly exclude that block by starting their CJK Extension B range at U+2A700 instead of U+20000. The two ranges do not overlap, and neither file is downloaded until a character inside its range is actually rendered (MDN, 2026).
That means the 25.6 KB is paid only by readers who open a chapter or entity page containing one of the 50 rare characters. A reader browsing the knowledge graph, which is all common glyphs, downloads zero bytes of it. A reader who opens 南山经 pays 25.6 KB once and gets 𪁺𩿧 instead of two tofu boxes.
The primary font is a different story and a less flattering one: the self-hosted Noto Serif CJK SC WOFF2 files are 16.7 MB and 17.8 MB. They are gated the same way — a Latin-only reader downloads neither — but any reader who sees a single Chinese character triggers the full download. That is the next thing on the list to subset, and the 25.6 KB Extension B file is the proof that subsetting works.
What Do 2,141 Static Pages Cost to Build?
They cost build time and disk, and they buy crawlability. generateStaticParams in src/app/shanhaijing/entities/[type]/[name]/page.tsx reads public/shanhaijing/data.json synchronously at build time with readFileSync, walks the 2,141 entities, maps each typeKey through a 15-entry slug table (bird_beast → bird-beast), and returns 2,141 { type, name } pairs (Next.js, 2026). The result is 2,141 prerendered entity pages, plus 15 type index pages and 19 chapter pages — 18 chapters plus Guo Pu's preface.
The numbers from the built output:
| Measure | Value |
|---|---|
| Entity detail pages | 2,141 |
| Type index pages | 15 |
| Chapter pages | 19 |
Total index.html files on the site |
2,304 |
| Average entity page size | 12,547 bytes |
| Total static output | 222 MB |
| Shanhaijing portion of the output | 81 MB |
Two things about this design are worth flagging, because both are sharp edges rather than features.
generateStaticParams swallows failure. The function is wrapped in try/catch and returns [] if the file cannot be read. In a static export there is no server to render missing paths on demand, so if data.json were absent during a build — say, because a .gitignore change excluded it — the build would succeed and emit zero entity pages. The site would deploy with 2,141 dead links and no error. The catch is there for the CI environment, where doc/shanhaijing/ does not exist and the prebuild script exits early, but it is doing double duty as a silent failure mode.
Prerendering is not free, and it is not always the right call. 222 MB of output for a blog is a lot; the Shanhaijing portion alone is 81 MB. Every entity page re-embeds its own copy of the entity's relations and chapter context as HTML. A client-side entity browser with one 5.9 MB JSON file would be smaller on disk and would render faster on repeat visits — and would be invisible to every crawler that does not execute JavaScript. Given that the entire point of the project is to make a 2,300-year-old text machine-readable and citable, prerendering 2,141 pages is the correct trade. It is not the obviously correct trade, and the next project of this shape might reasonably choose differently.
Frequently Asked Questions
Can you really build a force-directed graph without D3?
Yes, and the algorithm is smaller than the plumbing around it. The Fruchterman-Reingold simulation is about 40 lines; the other 580 lines in src/lib/shanhaijing-graph.ts handle graph construction, balanced 200-node truncation, connected-component packing and label collision. The complete interactive graph — layout, SVG renderer, drag, pan, zoom, filtering — ships as 27,861 bytes raw, 9,704 bytes gzipped (project data, 2026).
How many iterations does a force-directed layout need?
300 is enough for graphs of this size, and the temperature schedule matters more than the count. With an initial temperature of 90 units cooled by 0.299 per iteration, the default 200-node graph converges in about 24 ms in Node. Running 500 iterations changed the layout less than the random seed does, which is the real limitation: the result is a local optimum, not a unique answer.
Why is the metro map deterministic while the graph is not?
Because the metro map's coordinates are computed once at build time and frozen into JSON, while the graph's initial positions come from Math.random(). The panorama's layoutChain output is written to panorama-layout.json (183.0 KB raw, 12.0 KB gzipped) for all 26 chains, so every reader sees identical station positions. The force graph re-seeds on every load, so its arrangement varies — a deliberate trade that makes "Reset layout" meaningful.
How do you ship a font for characters that no font supports?
Subset a font that does have them, and gate it with unicode-range. The project ships a 26,196-byte BabelStone Han WOFF2 containing 159 codepoints — 95 ASCII, 14 punctuation marks and 50 CJK Extension B ideographs including 𪁺 (U+2A07A) — which is 0.35% of the full 7,438,036-byte font. The unicode-range: U+20000-2A6DF declaration means browsers download it only when one of those characters renders.
Is "no dependencies" actually faster?
Not by as much as the genre suggests. The four D3 modules that would cover the same ground — selection, drag, zoom, force — total 35,992 bytes raw and 12,441 bytes gzipped, against 9,704 bytes gzipped for the hand-written equivalent. The saving is about 2.7 KB gzipped, or 22%. Against a full graph library it is much larger: cytoscape.js is 116,568 bytes gzipped and vis-network is 127,278. The honest reason to hand-write was control over the layout and the data model, not bundle size.
Conclusion
The engineering story of this project is mostly a story about deciding where work belongs. The force simulation belongs in the browser, because it is interactive and the user re-seeds it. The metro-map layout belongs in the build, because it must be identical for every reader. The entity type counts belong in a TypeScript constant, because they change once per build. The 6.2 MB monolith belonged to none of those three places, which is why it is now six files.
Hand-writing the visualizations was the part I expected to regret and did not. Not because libraries are bad — d3-force is 3 KB gzipped, well-tested and better than my implementation at the thing it does — but because the graph I needed to draw was not a generic graph. It was a fragmented graph with a deliberate 200-node budget, a need for balanced sampling across relation types, a need for label prioritisation by node size, and a need for the layout to be frozen or fresh depending on the view. Every one of those requirements is a place where a generic library would have needed a workaround, and most of them are fifteen lines of hand-written code.
The honest caveats are in the post above: 21 nodes fall through the truncation-filter gap, the hub overview traded a fetch for a constant that can drift, two of the six split files are still over 5 MB, and the self-hosted primary font is 16.7 MB because I have only subset the rare characters so far. The site is at findns.cc/shanhaijing if you want to open the knowledge graph, the panorama or the mountain-focus view and check any of these numbers against what your own browser does.
If you want the rest of the project: the hub post covers what the graph contains, the 63 contradictions post covers what the machine found, the pipeline post covers how the relations were extracted, the nine-tailed fox post covers the most famous thing that is not in the data, and the missing-character post covers the one 萬 that shifted a chain by 10,090 li.
Sources
- Fruchterman, T. M. J. and Reingold, E. M., "Graph Drawing by Force-directed Placement," Software: Practice and Experience 21(11), 1991, https://doi.org/10.1002/spe.4380211102
- Next.js, "Static Exports" (App Router deployment documentation), retrieved 2026-10-21, https://nextjs.org/docs/app/building-your-application/deploying/static-exports
- Next.js, "generateStaticParams" (API reference), retrieved 2026-10-21, https://nextjs.org/docs/app/api-reference/functions/generate-static-params
- MDN Web Docs, "@font-face: unicode-range," retrieved 2026-10-21, https://developer.mozilla.org/en-US/docs/Web/CSS/@font-face/unicode-range
- BabelStone, "BabelStone Han" (font project and Extension B coverage), retrieved 2026-10-21, https://www.babelstone.co.uk/Fonts/Han.html
- Google Noto Fonts, "Noto Serif CJK" (source and codepoint coverage), retrieved 2026-10-21, https://github.com/notofonts/noto-cjk
- D3, "d3-force" (v3.0.0, 8,300 bytes minified), retrieved 2026-10-21, https://d3js.org/d3-force
- Cytoscape.js, "Graph theory library for visualization and analysis" (v3.30.2, 373,304 bytes minified), retrieved 2026-10-21, https://js.cytoscape.org
- vis.js, "vis-network" (v9.1.9, 476,620 bytes minified), retrieved 2026-10-21, https://github.com/visjs/vis-network
- npm/unpkg package distributions measured for minified and gzip -9 sizes, retrieved 2026-10-21, https://unpkg.com/[email protected]/dist/d3-force.min.js
- Project data, "Shanhaijing knowledge graph" (source files, layout output and measured payload sizes), retrieved 2026-10-21, https://findns.cc/shanhaijing